My 2023 in Review

In a blog like mine with a fairly low readership, one of its most useful purposes is that of a historical map. A trail or witness to the learning and creating that I’ve done. Creating this list helps me express my gratitude and appreciation for all the people who helped me reach my goals and learn and grow. 

2023 was a good year. Here’s a recap (before January 2024 passes!) … well, this post apparently didn’t publish in January, so we’ll go with “better late than never.”

My one word was Engage. Considering that I spent most of the year thinking that my word was Amplify (from 2022), I might just recycle the 2023 word and try over.

This Blog: “What I Learned Today…”

  • # of posts: 42
  • # of words: 18900 (not my highest)
  • Views: 18101; Visitors: almost 10 000

YouTube

  • Published videos: 68
  • YouTube Live videos: 11
  • Views: 30 681 (only 11% from Canada)

Podcasts (Prairie Rose Possibilities, The Podcast)

Podcast guest: 3 times

Professional Development Offered:

  • sessions at ISTE23 in Philadelphia: 6
  • ISTE Digital Escape Rooms created with Greta Sandler, Amanda Nyguen and Maggie Pickett: 2 (topics of UDL and Digital Citizenship)
  • AI sessions delivered virtually: 12; in person 6; consultations with AI company founders: 3
  • Technology training in Africa (Uganda and Zambia): 7 days
  • Sessions presented or hosted for Logics Academy: 29
  • Sessions presented at the regional level: 4
  • PD video series created:
    • After School AI mini-series (6 episodes)
    • Google Site mini-tutorials (15 videos)
    • Search Blitz (10 episodes)
    • Clean-Up Blitz (4 episodes with 4 more to come)
    • Fun with Google A-Z (completed January 1, 2024)
    • Outlook email tips (4 episodes)
    • PRPS Word Work series (13 videos)
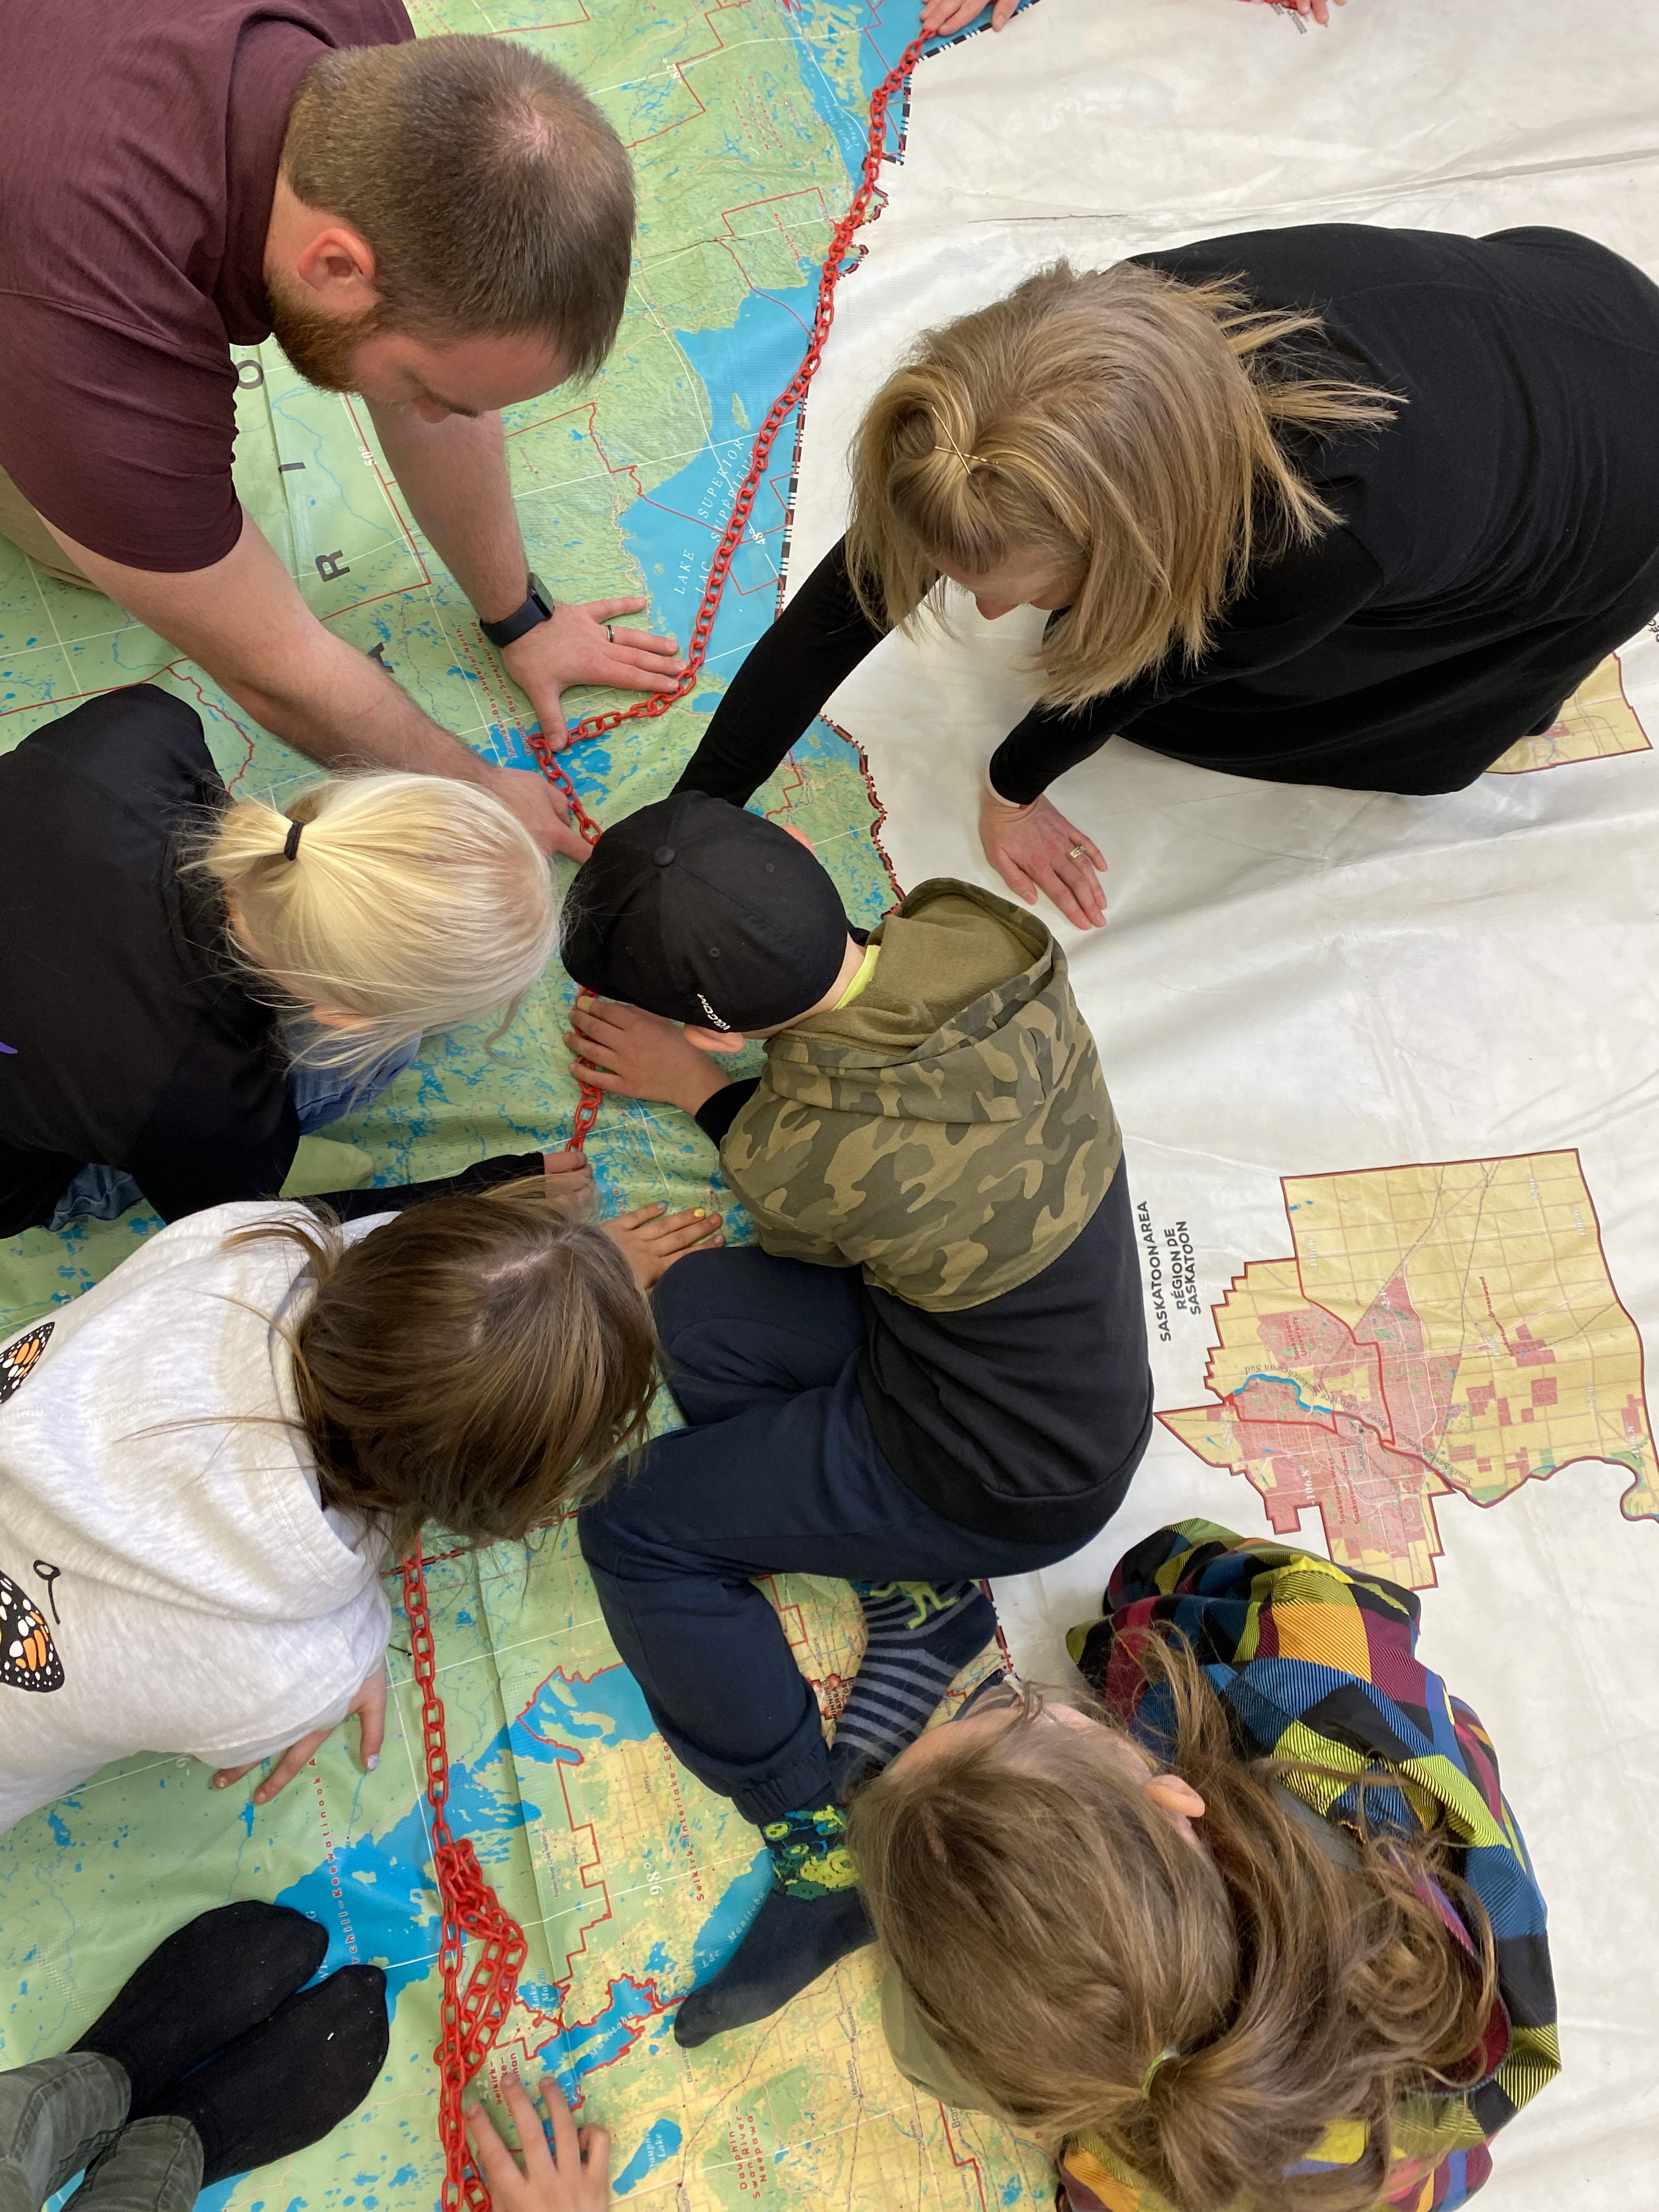
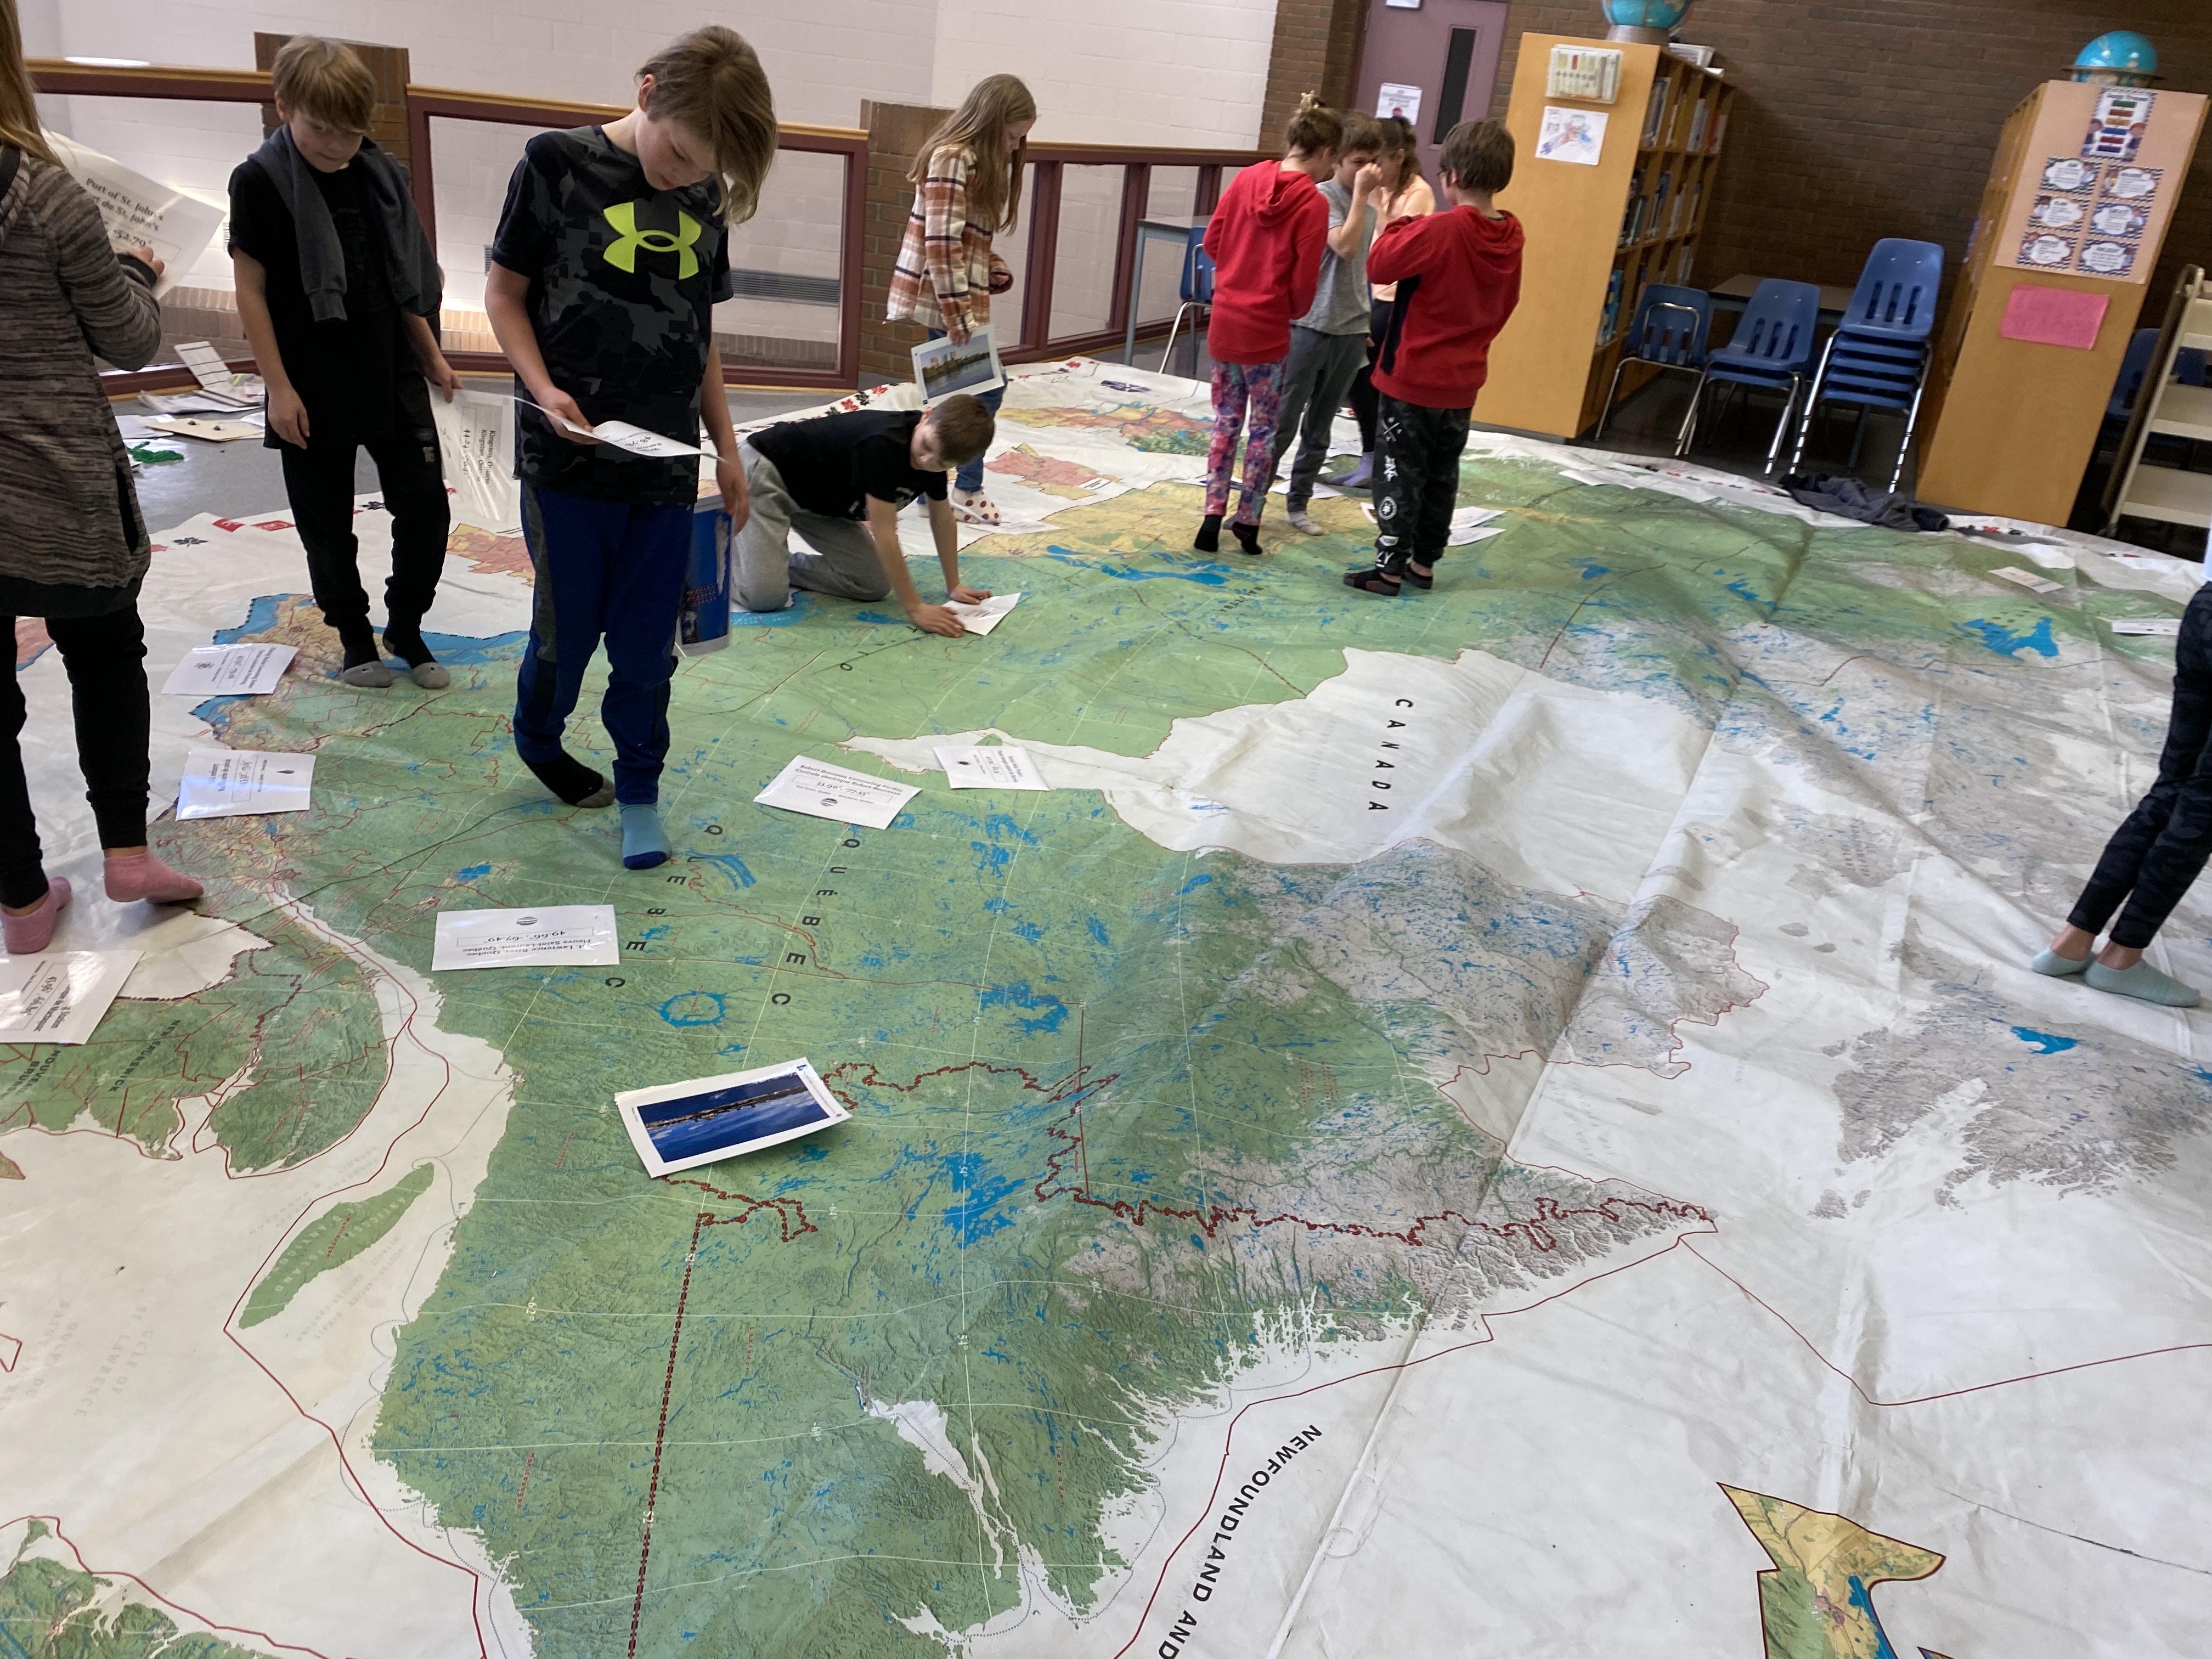
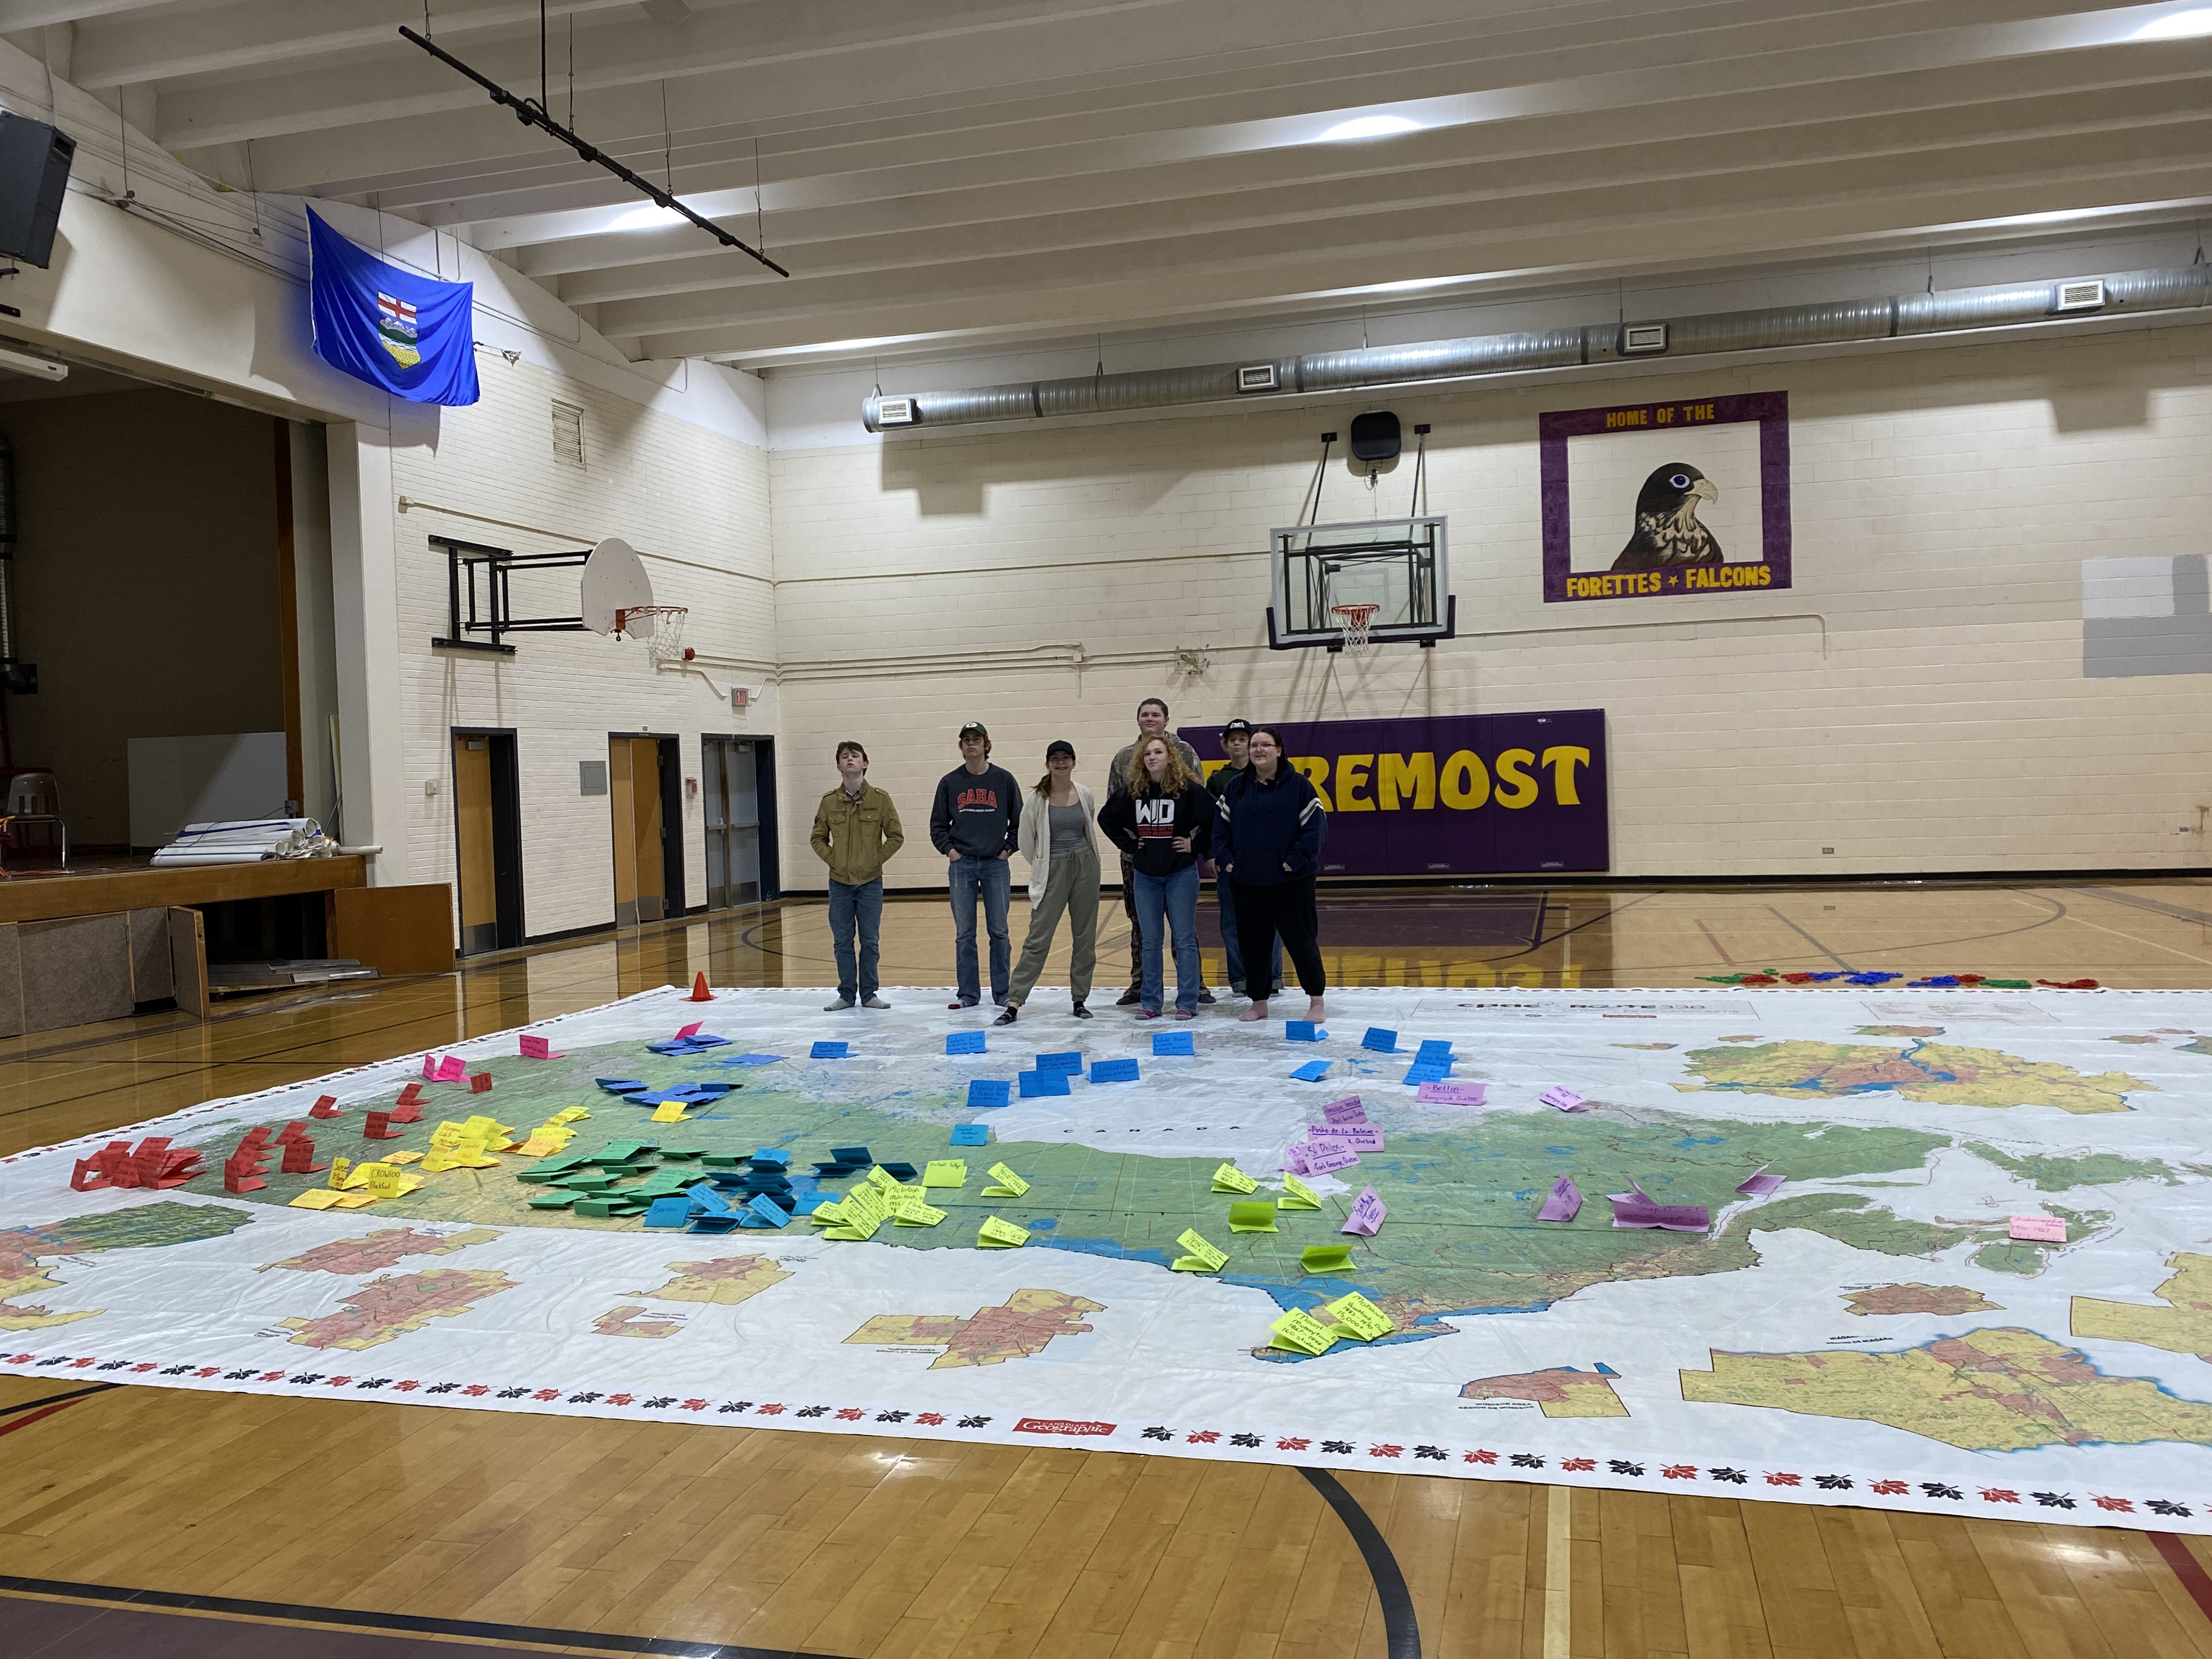
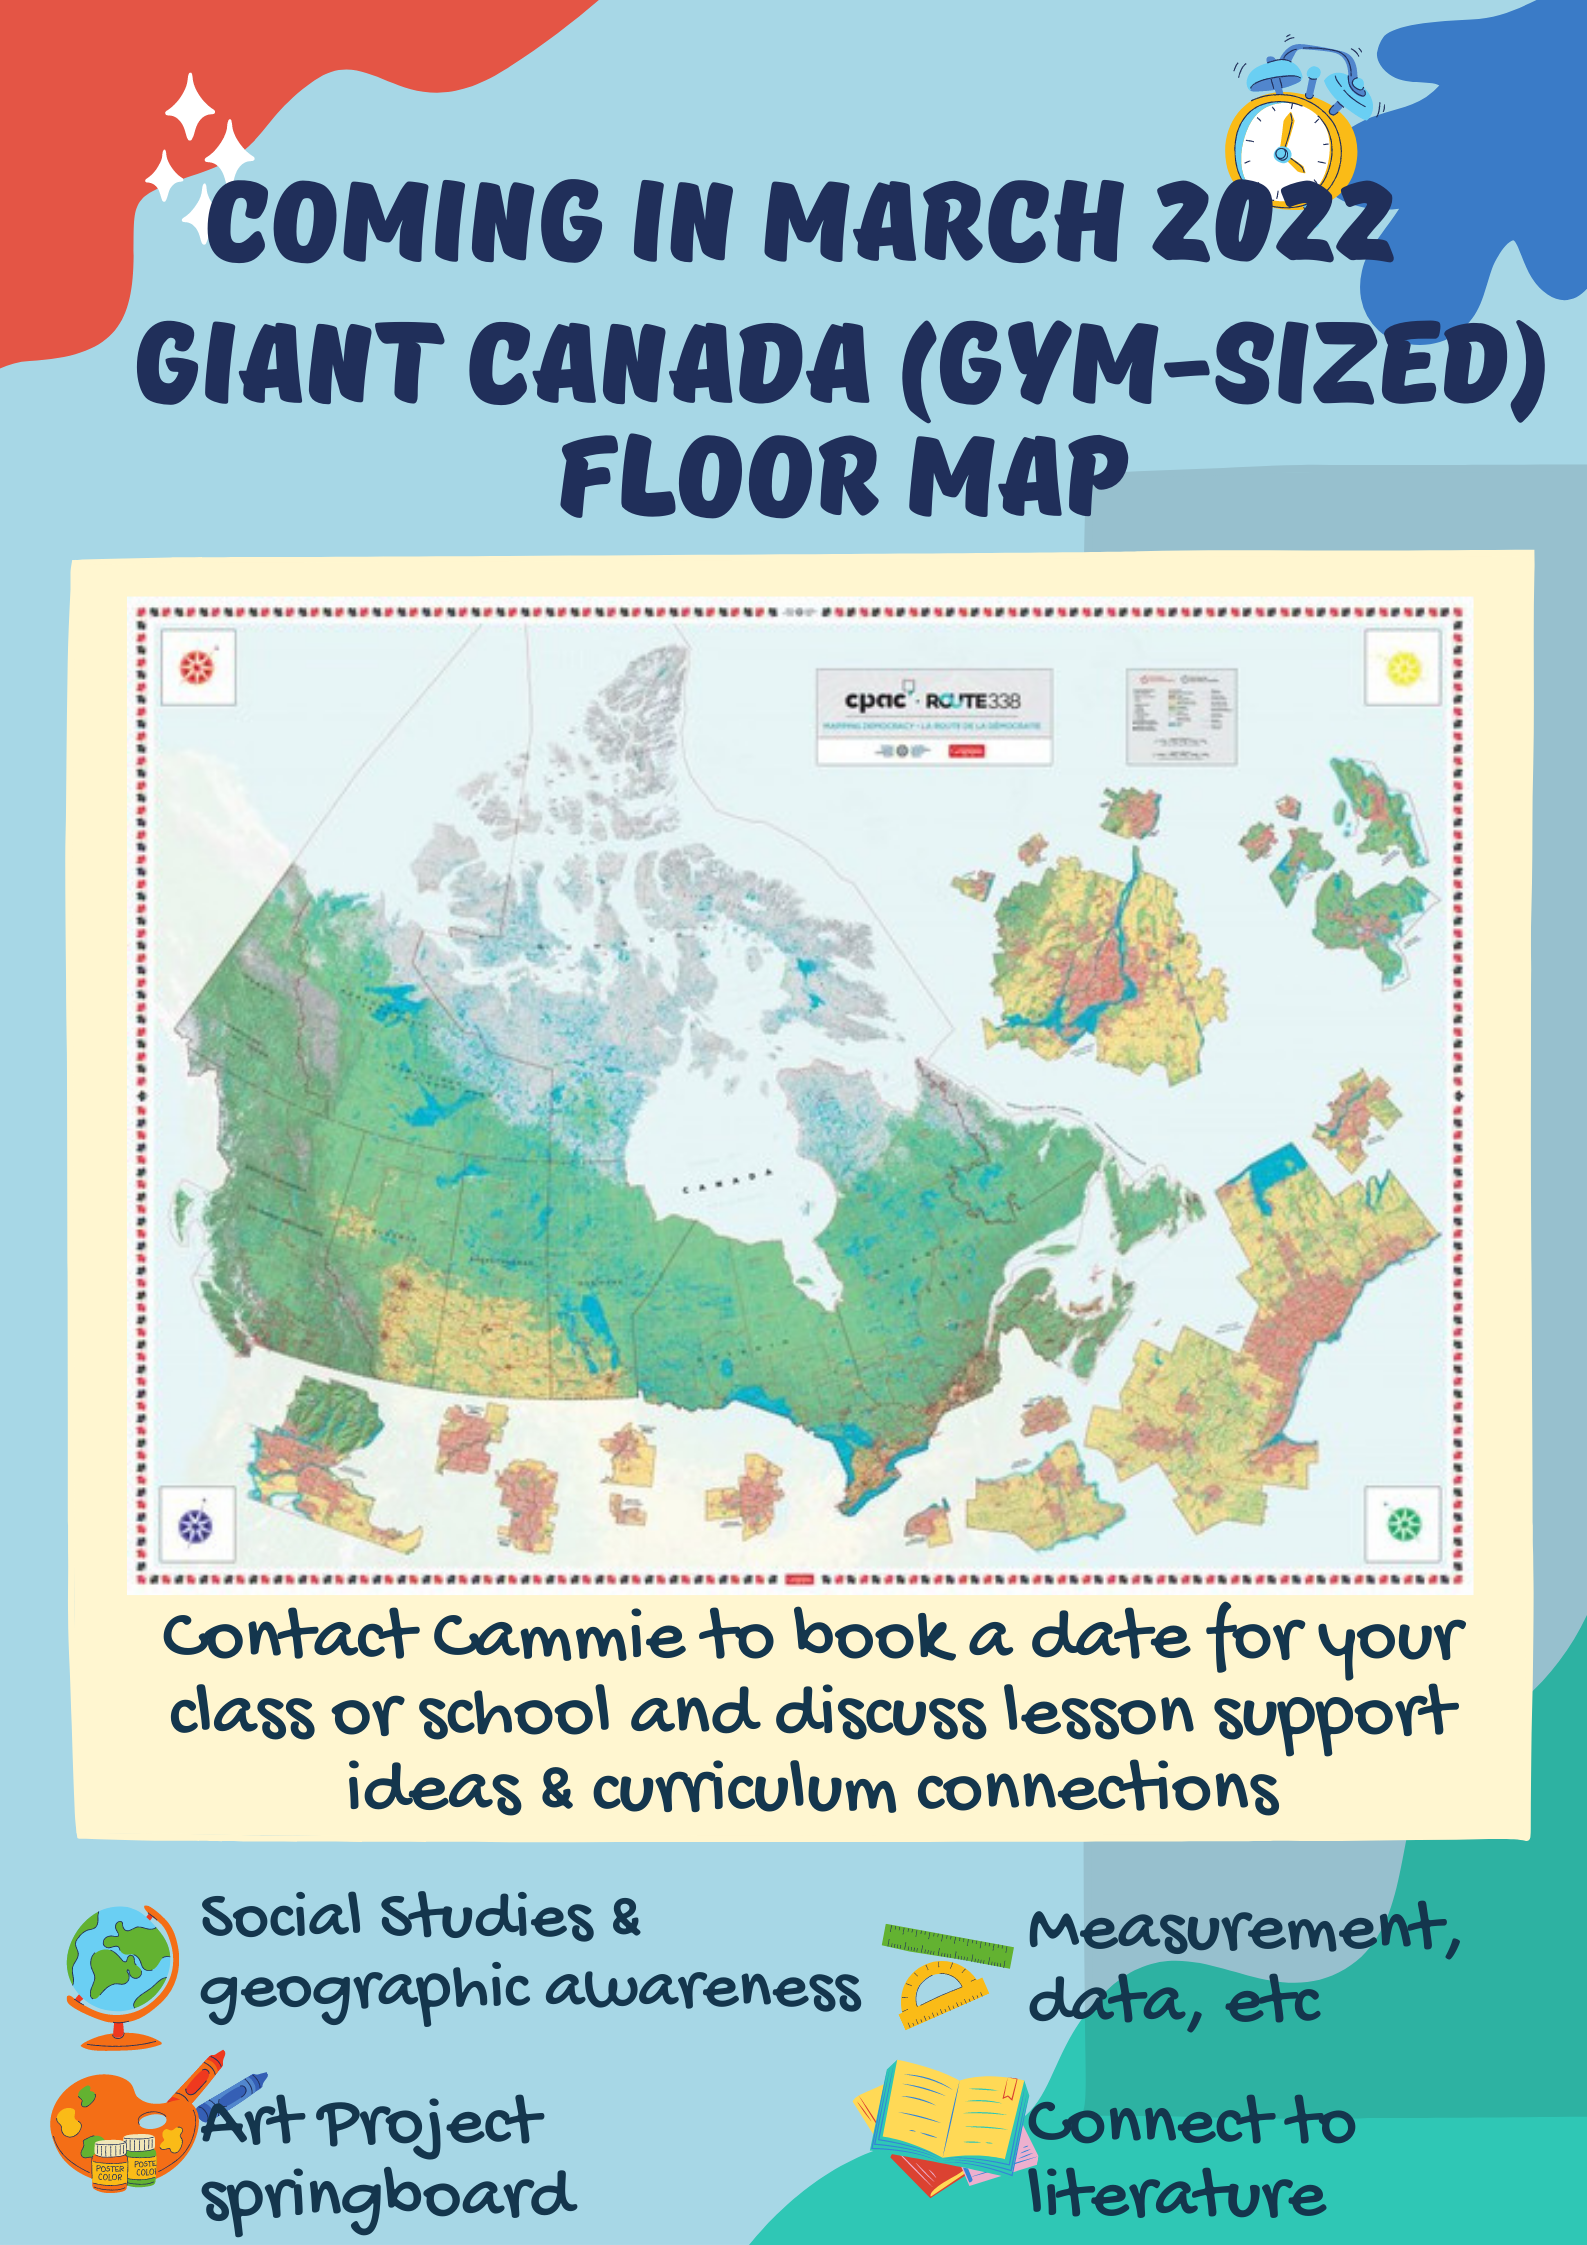
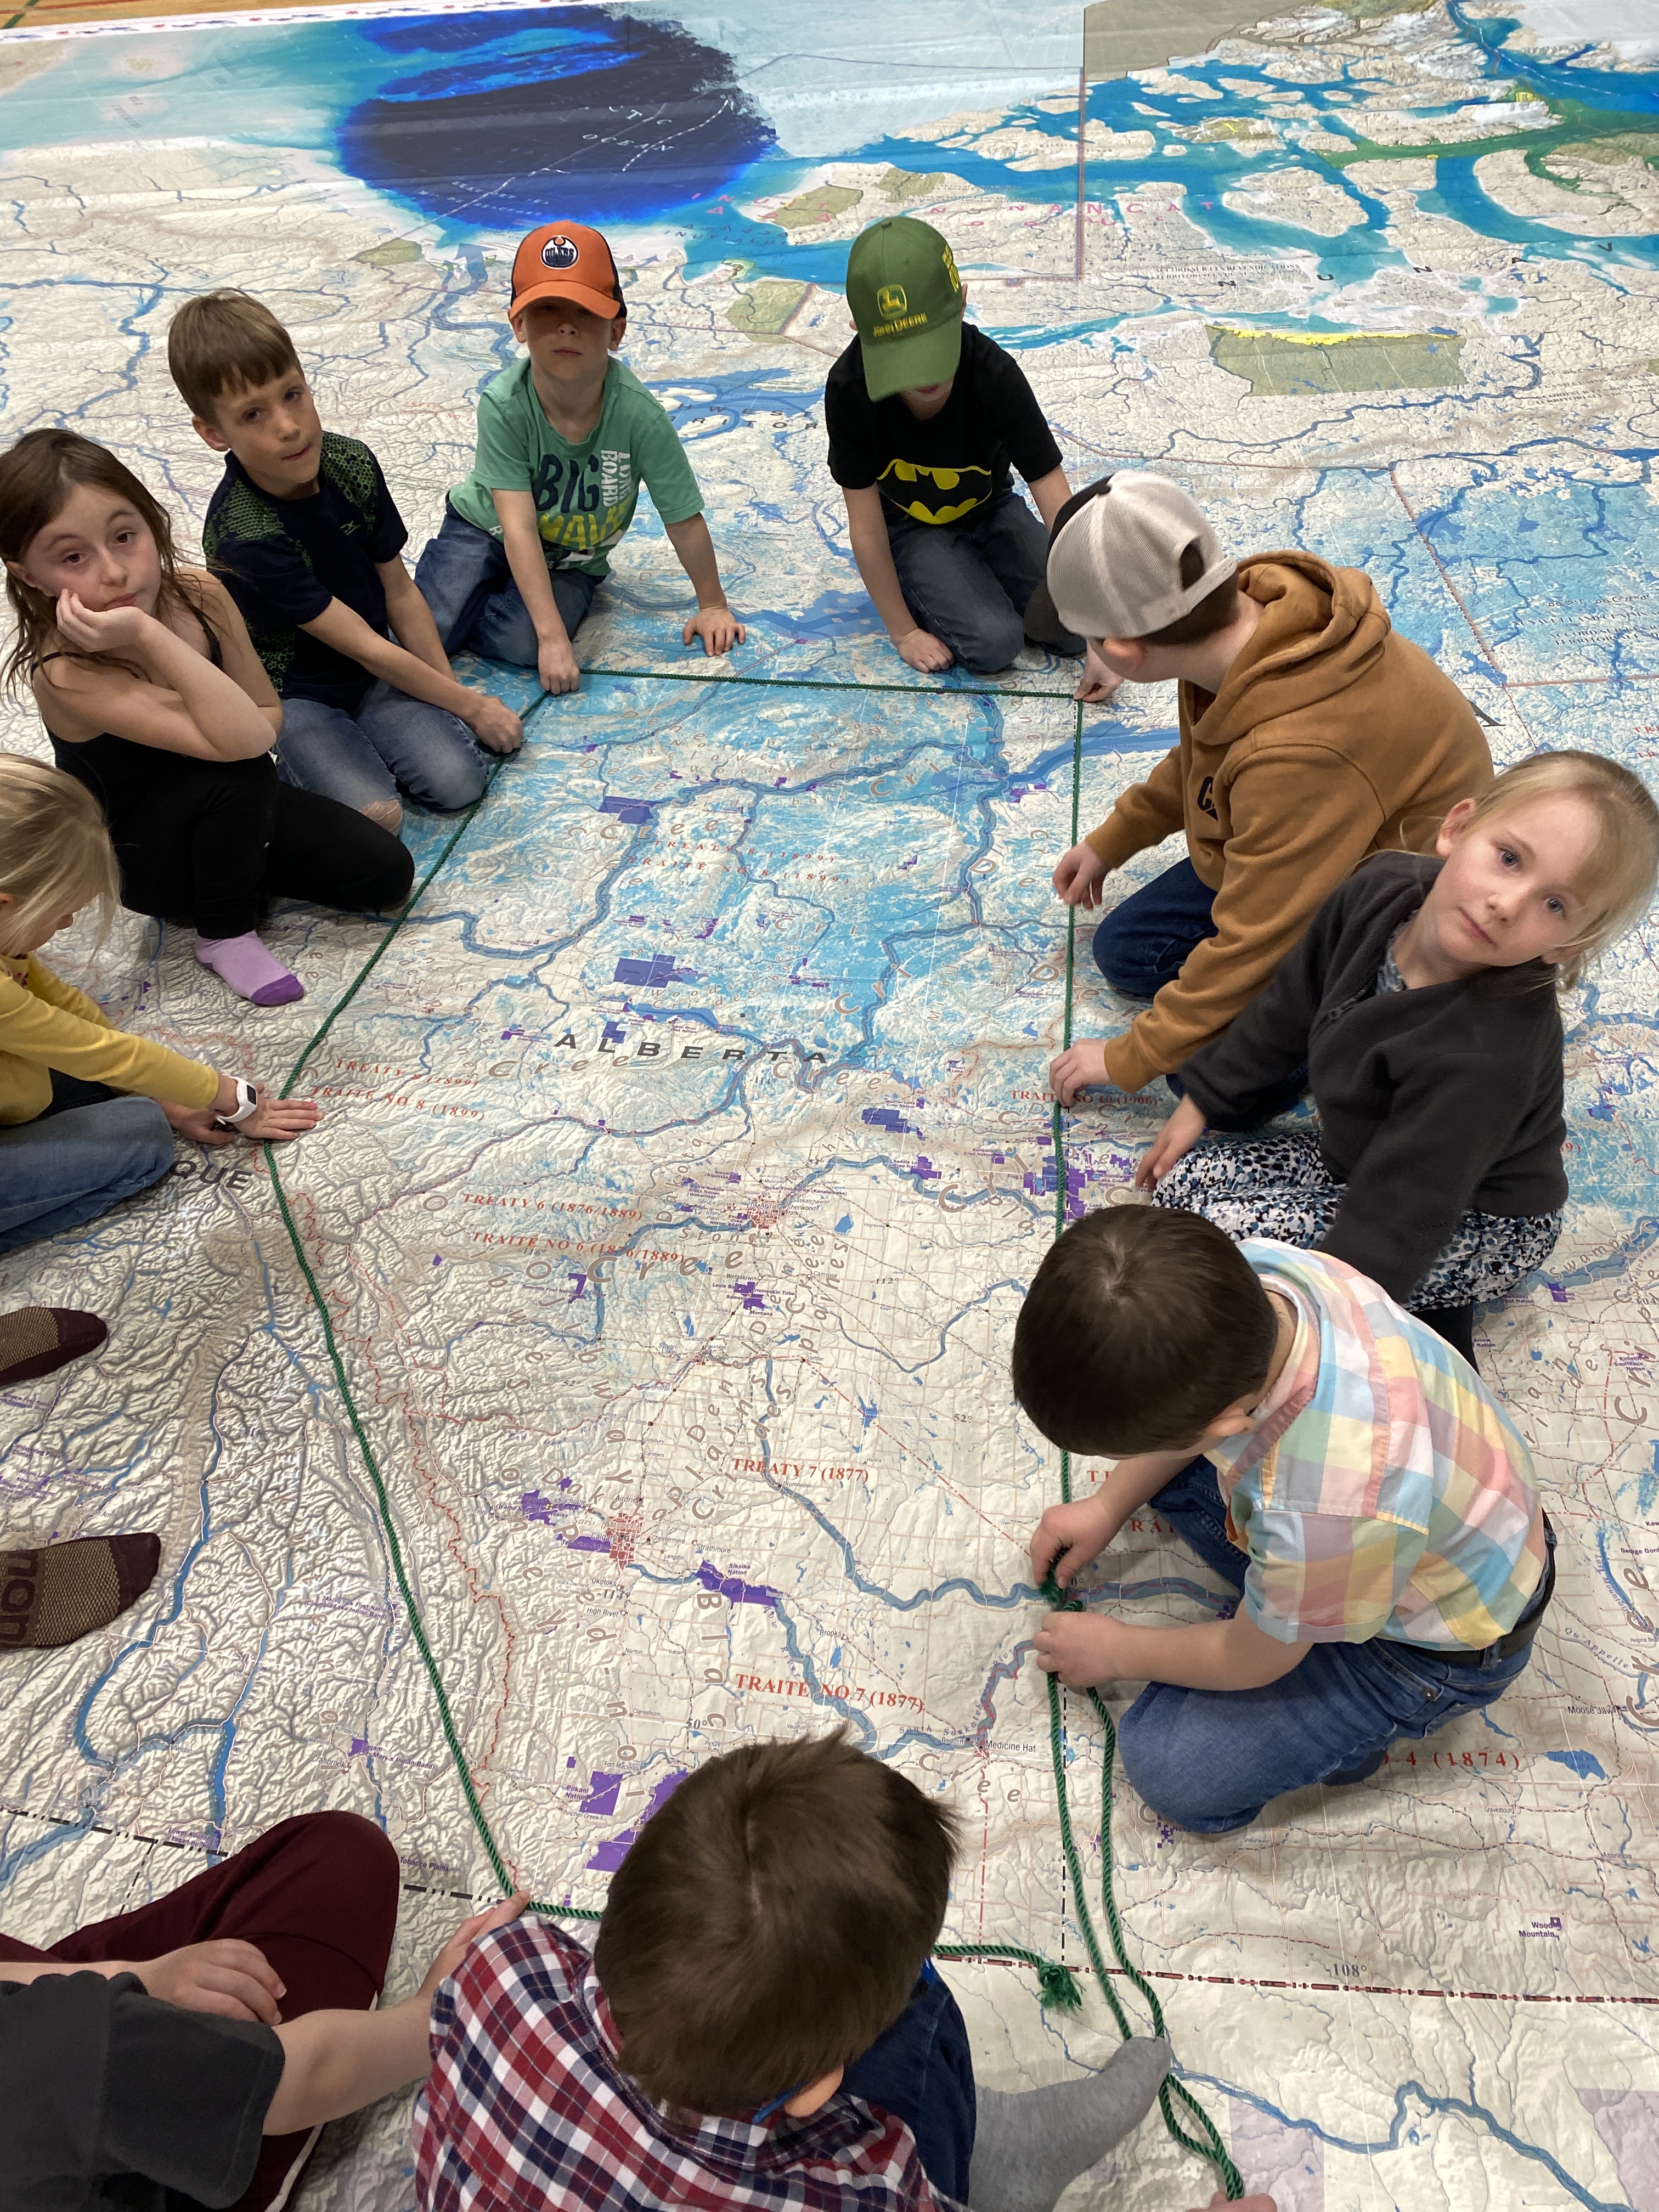
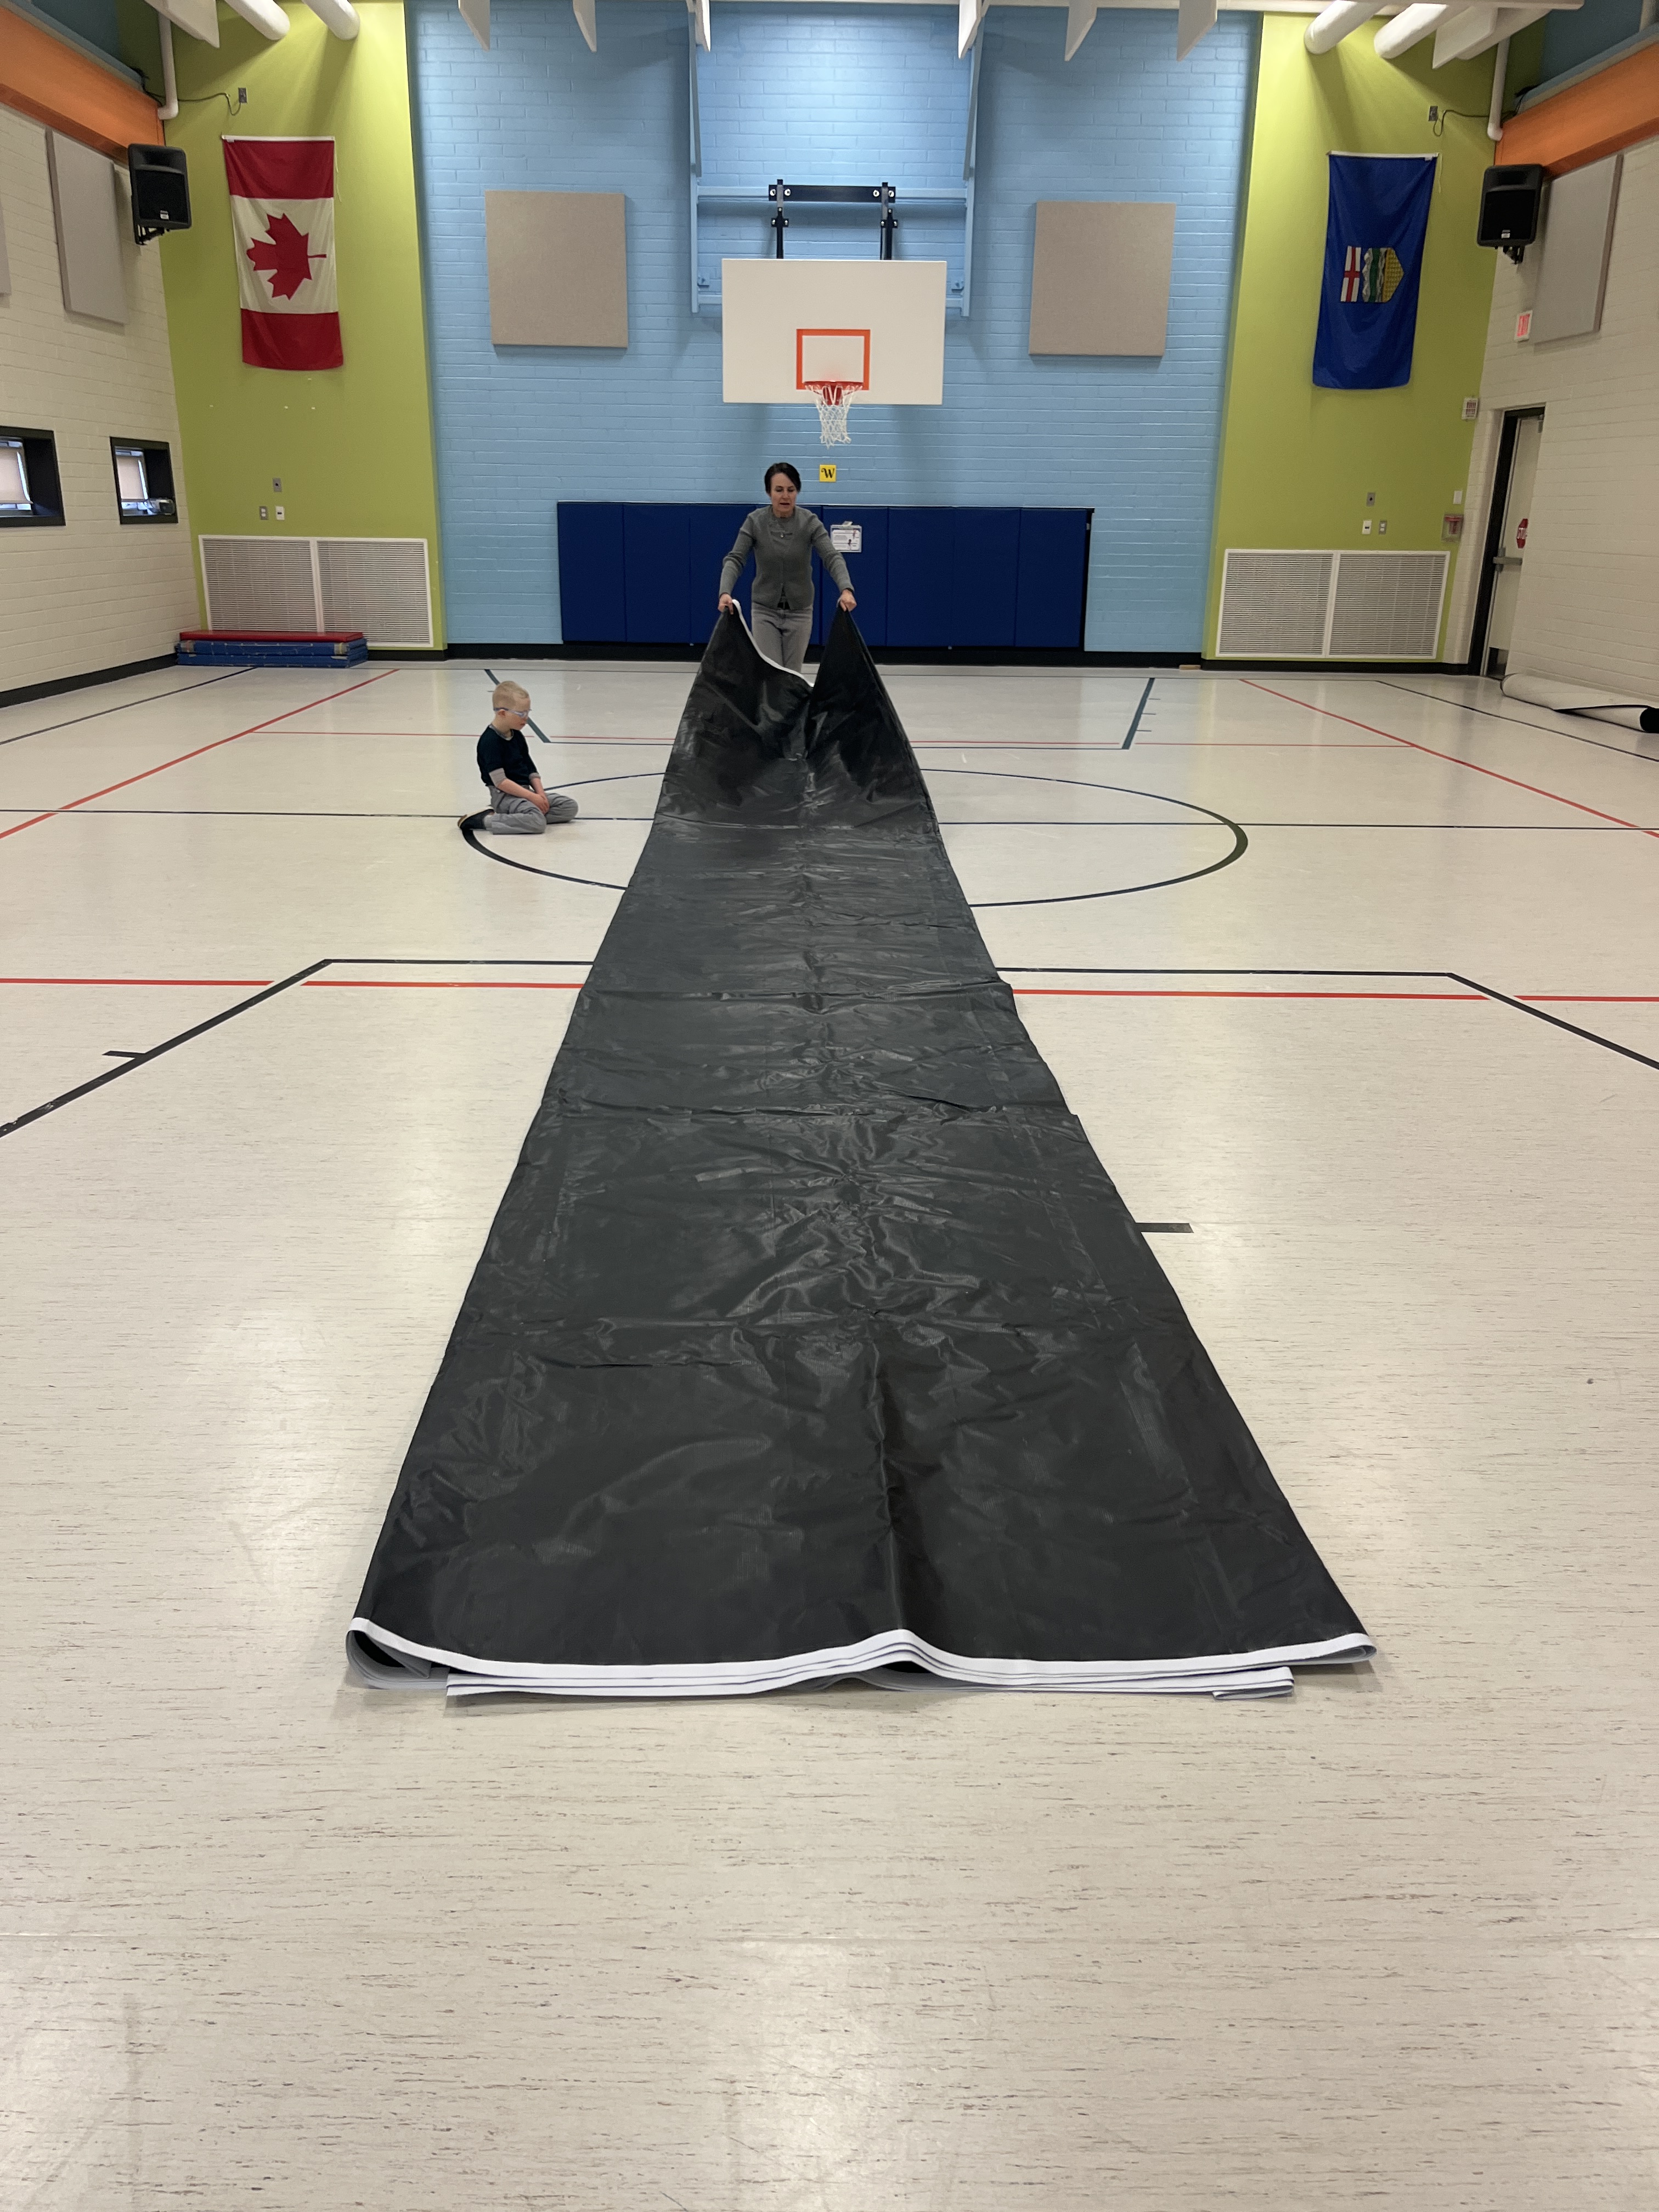
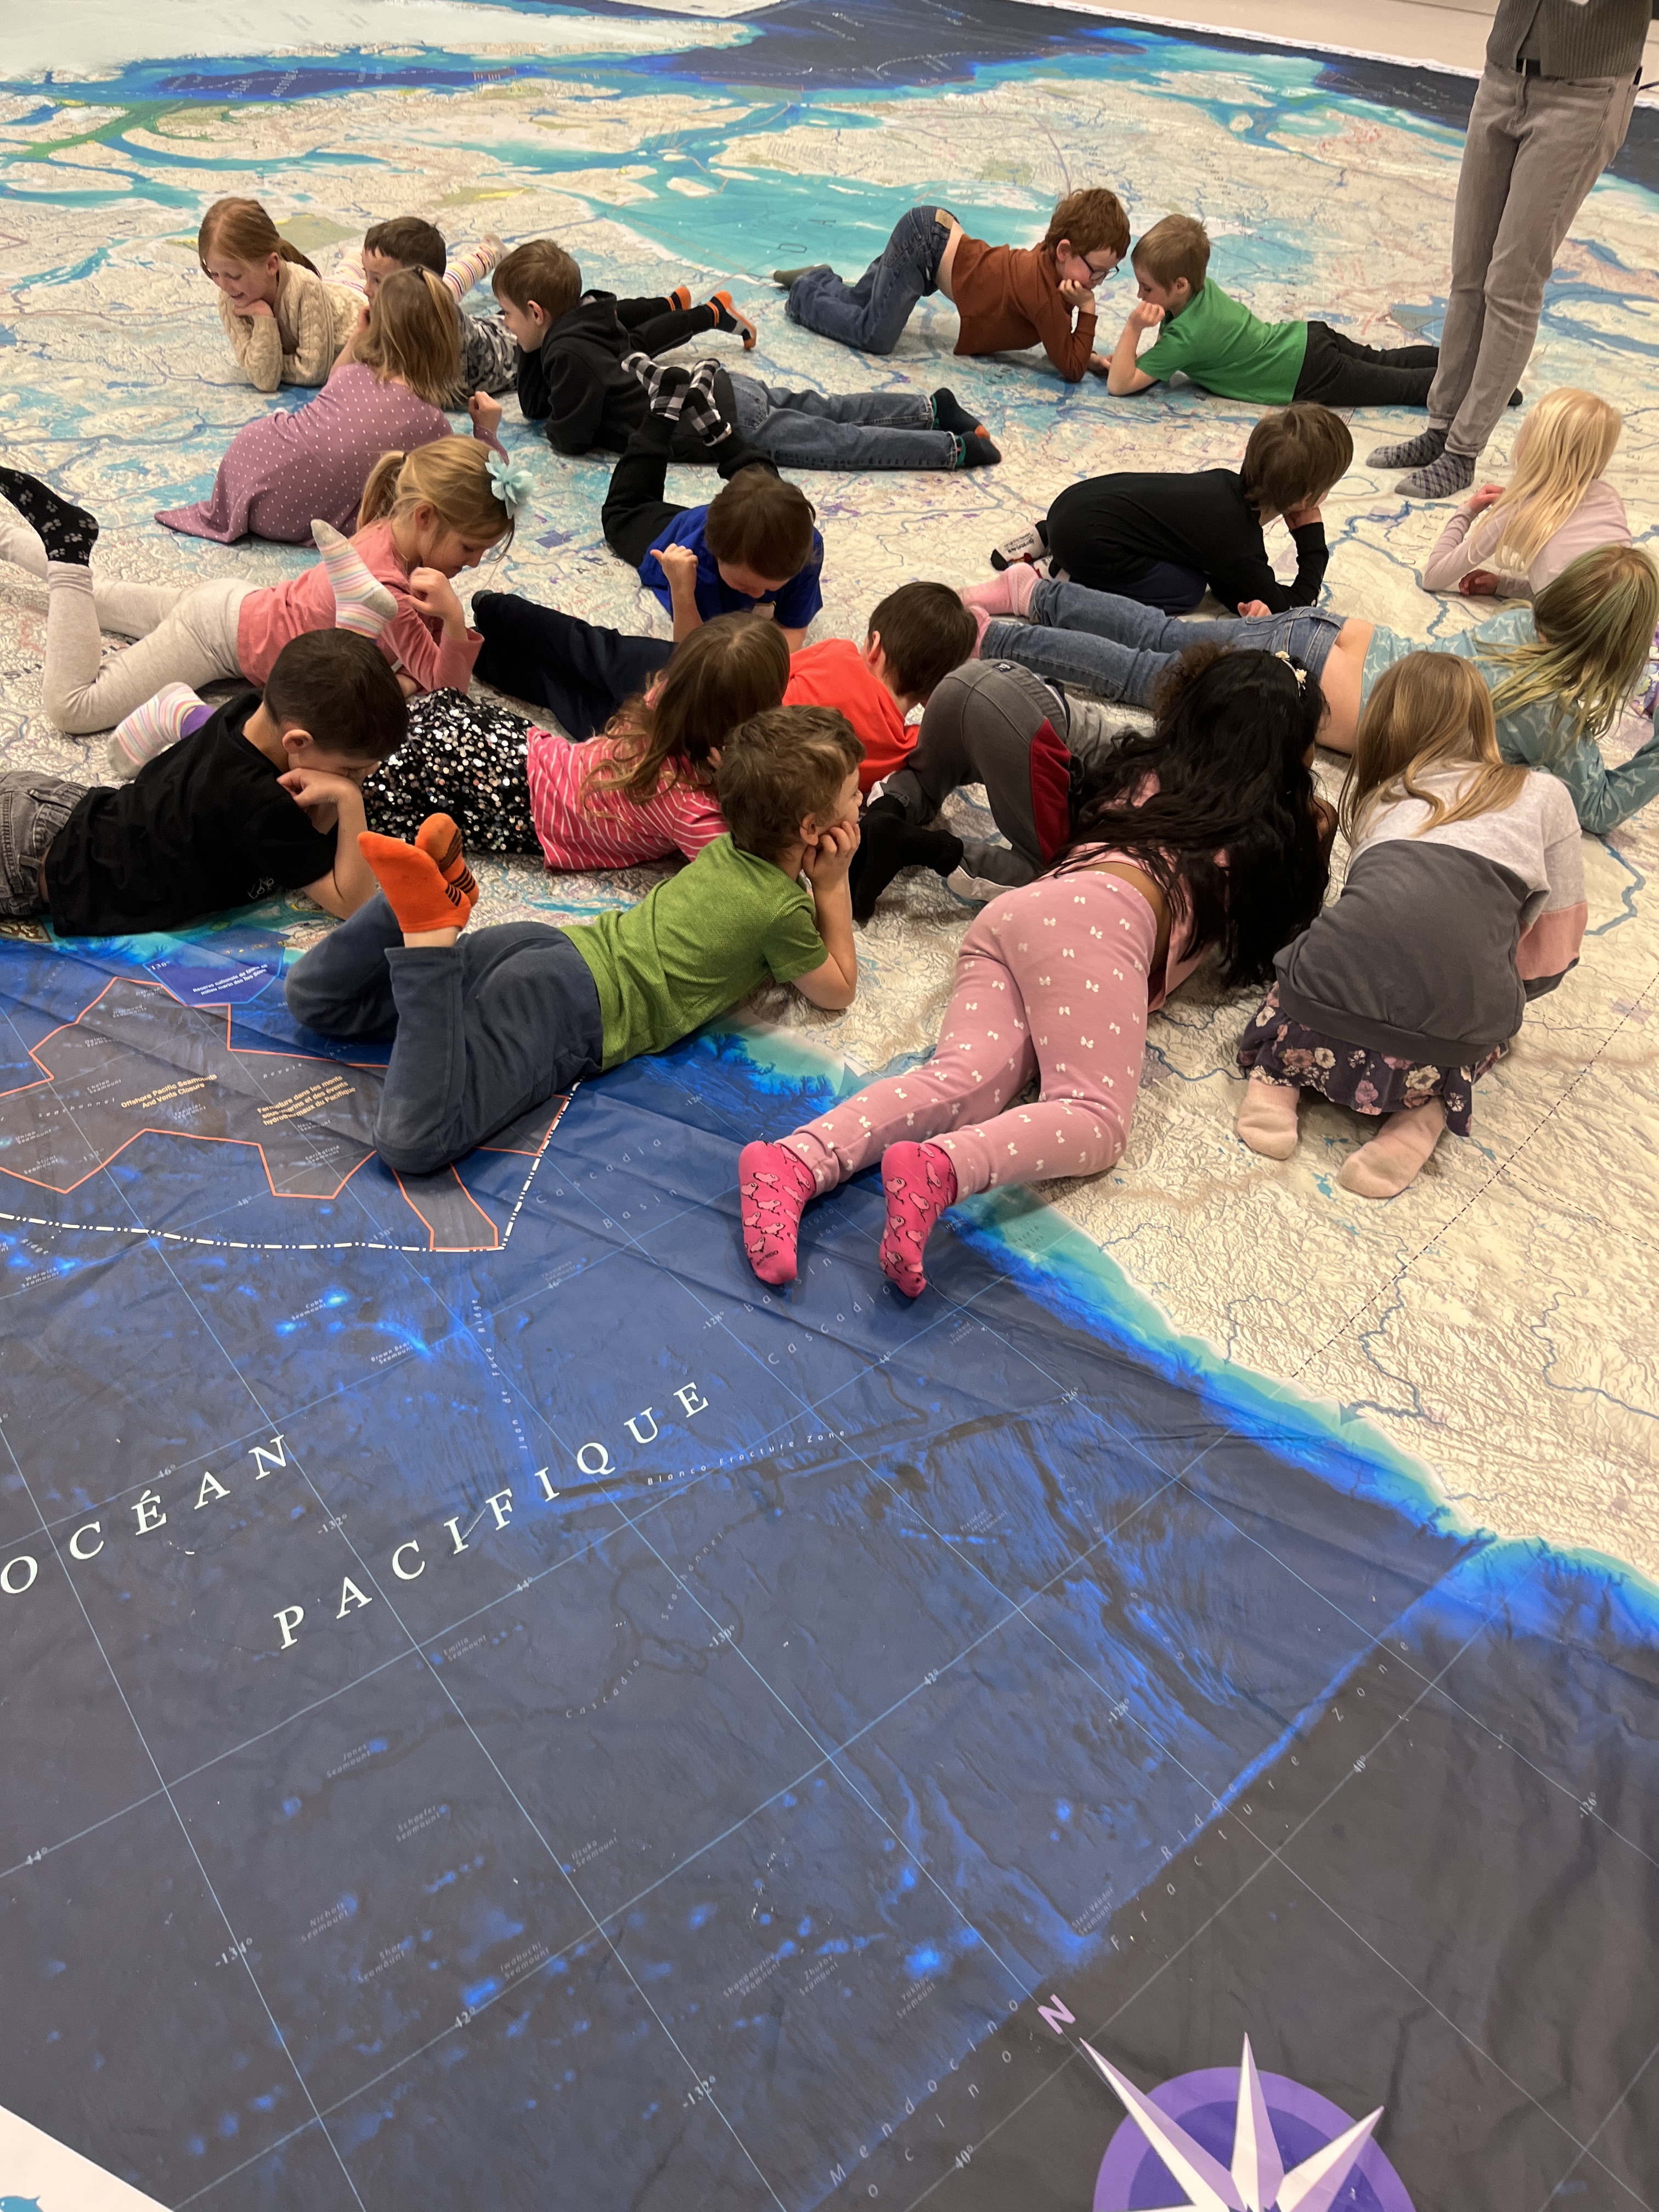
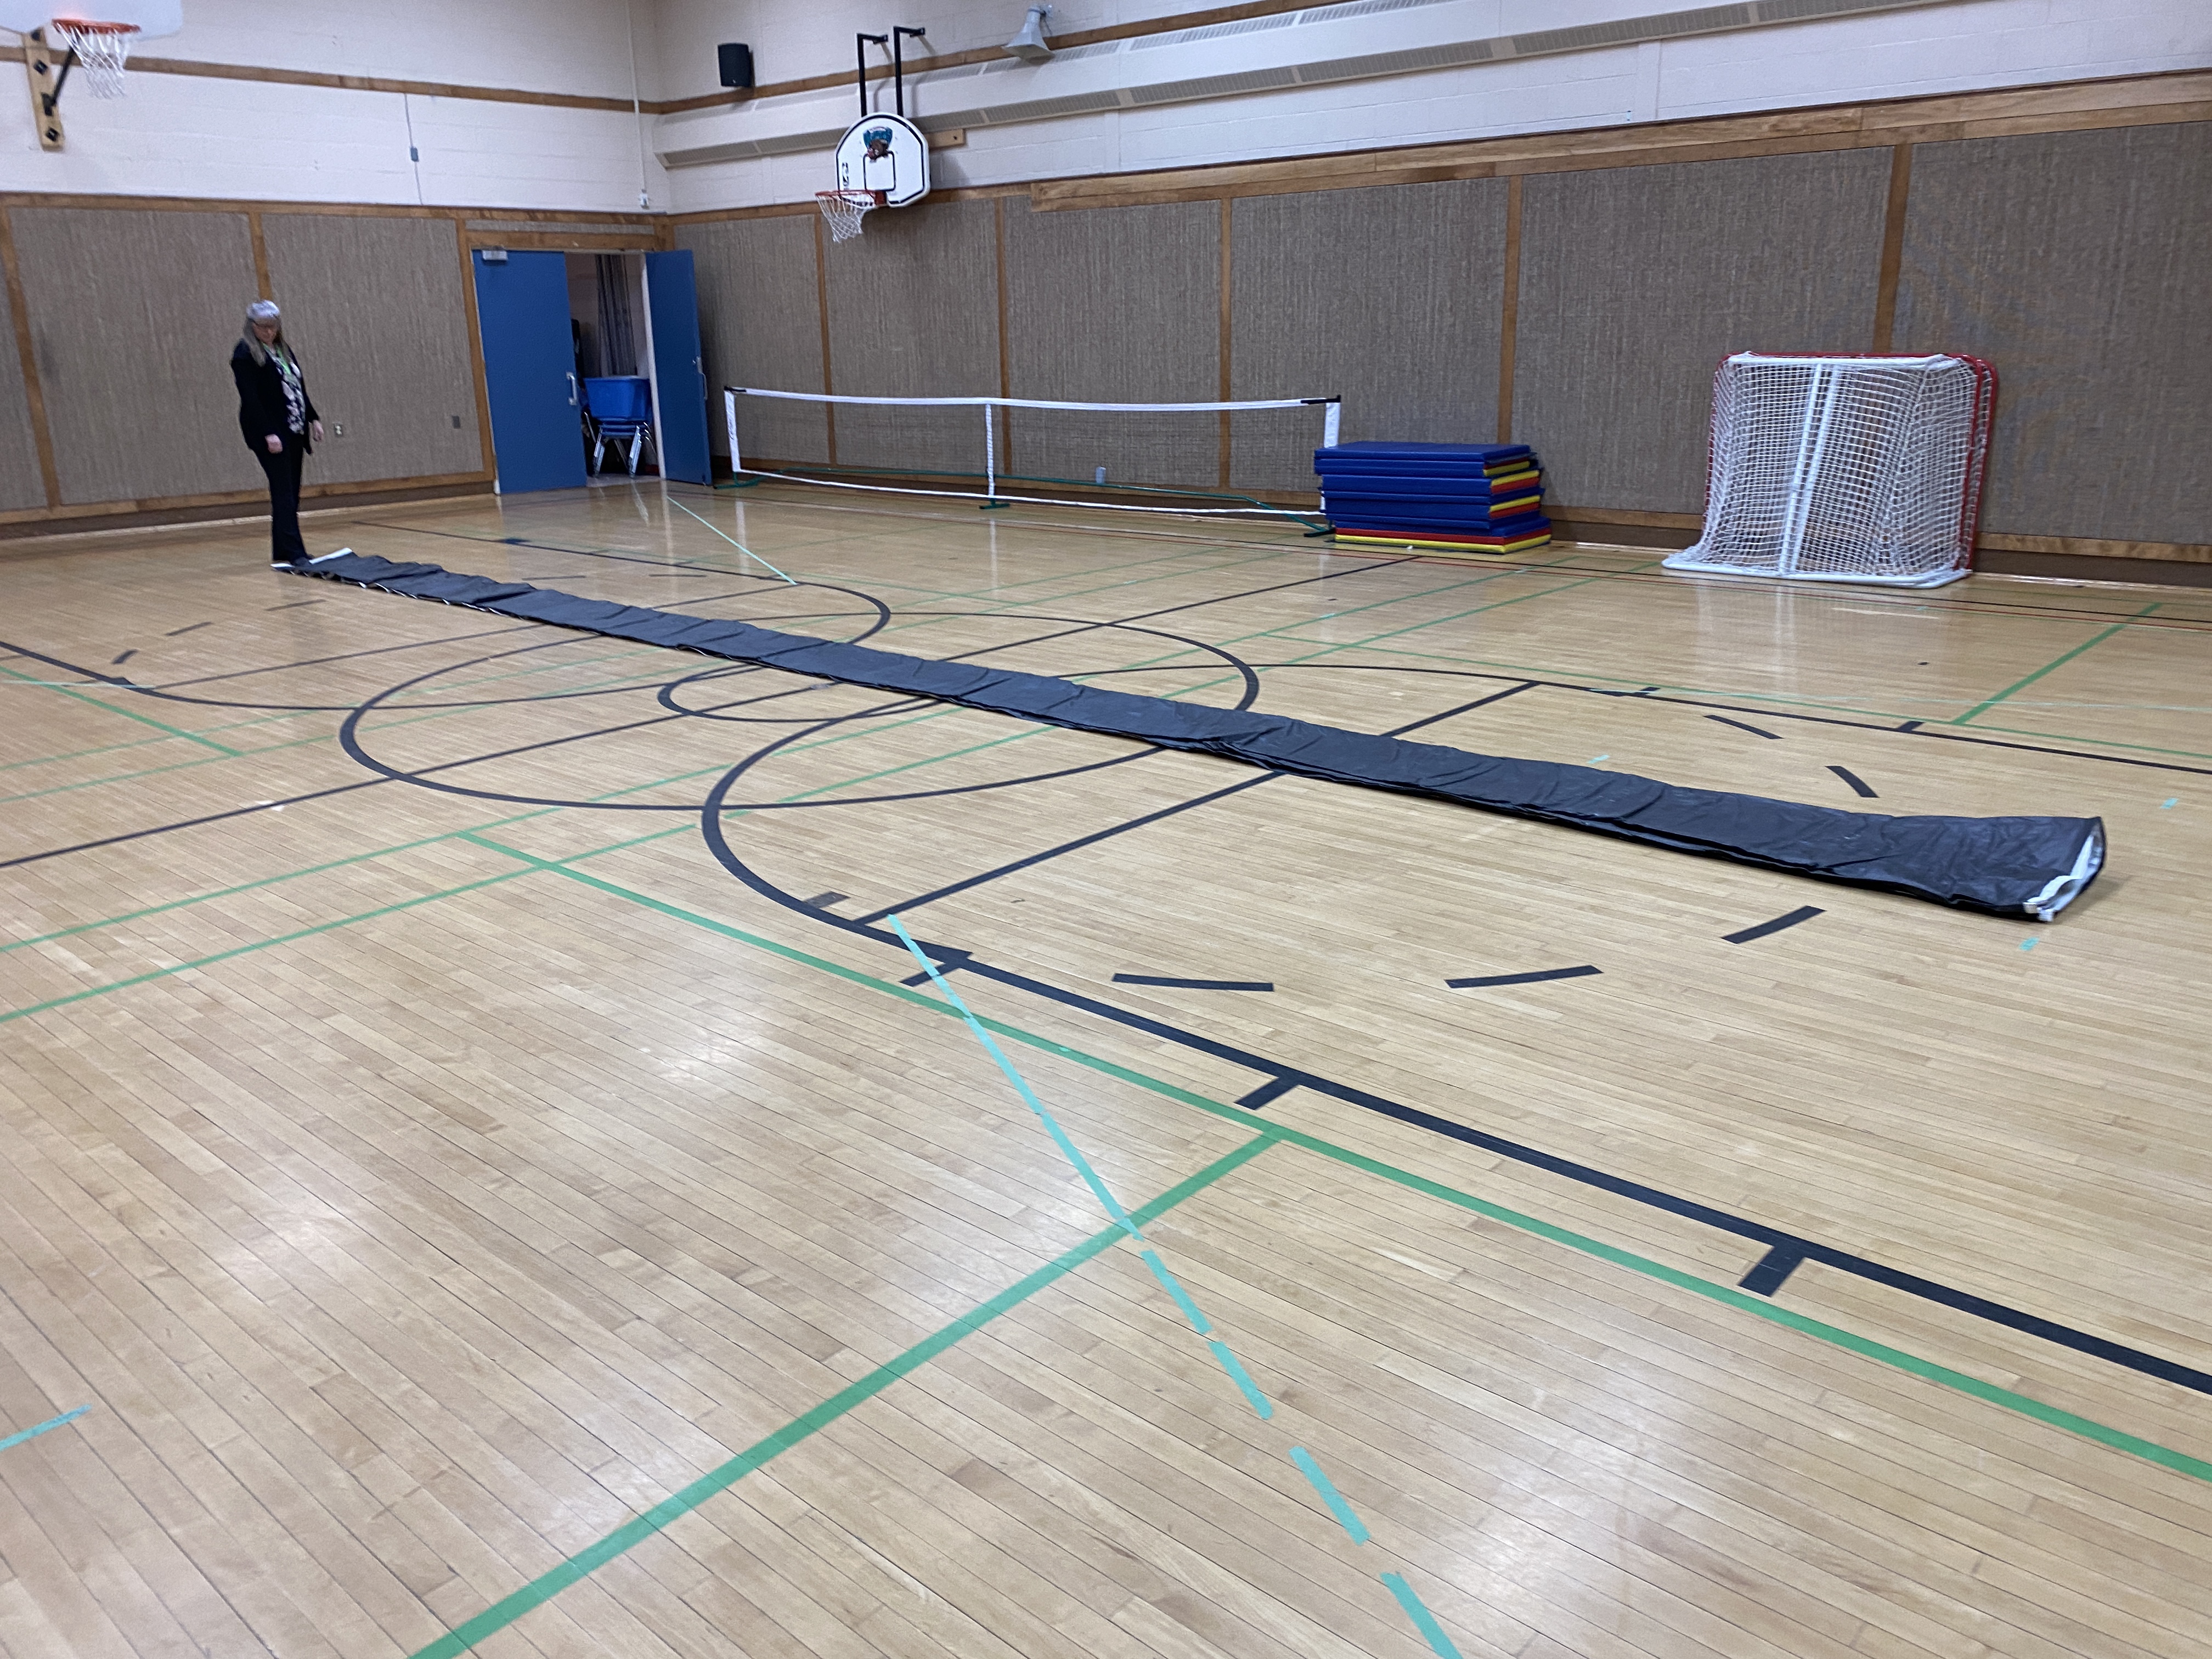
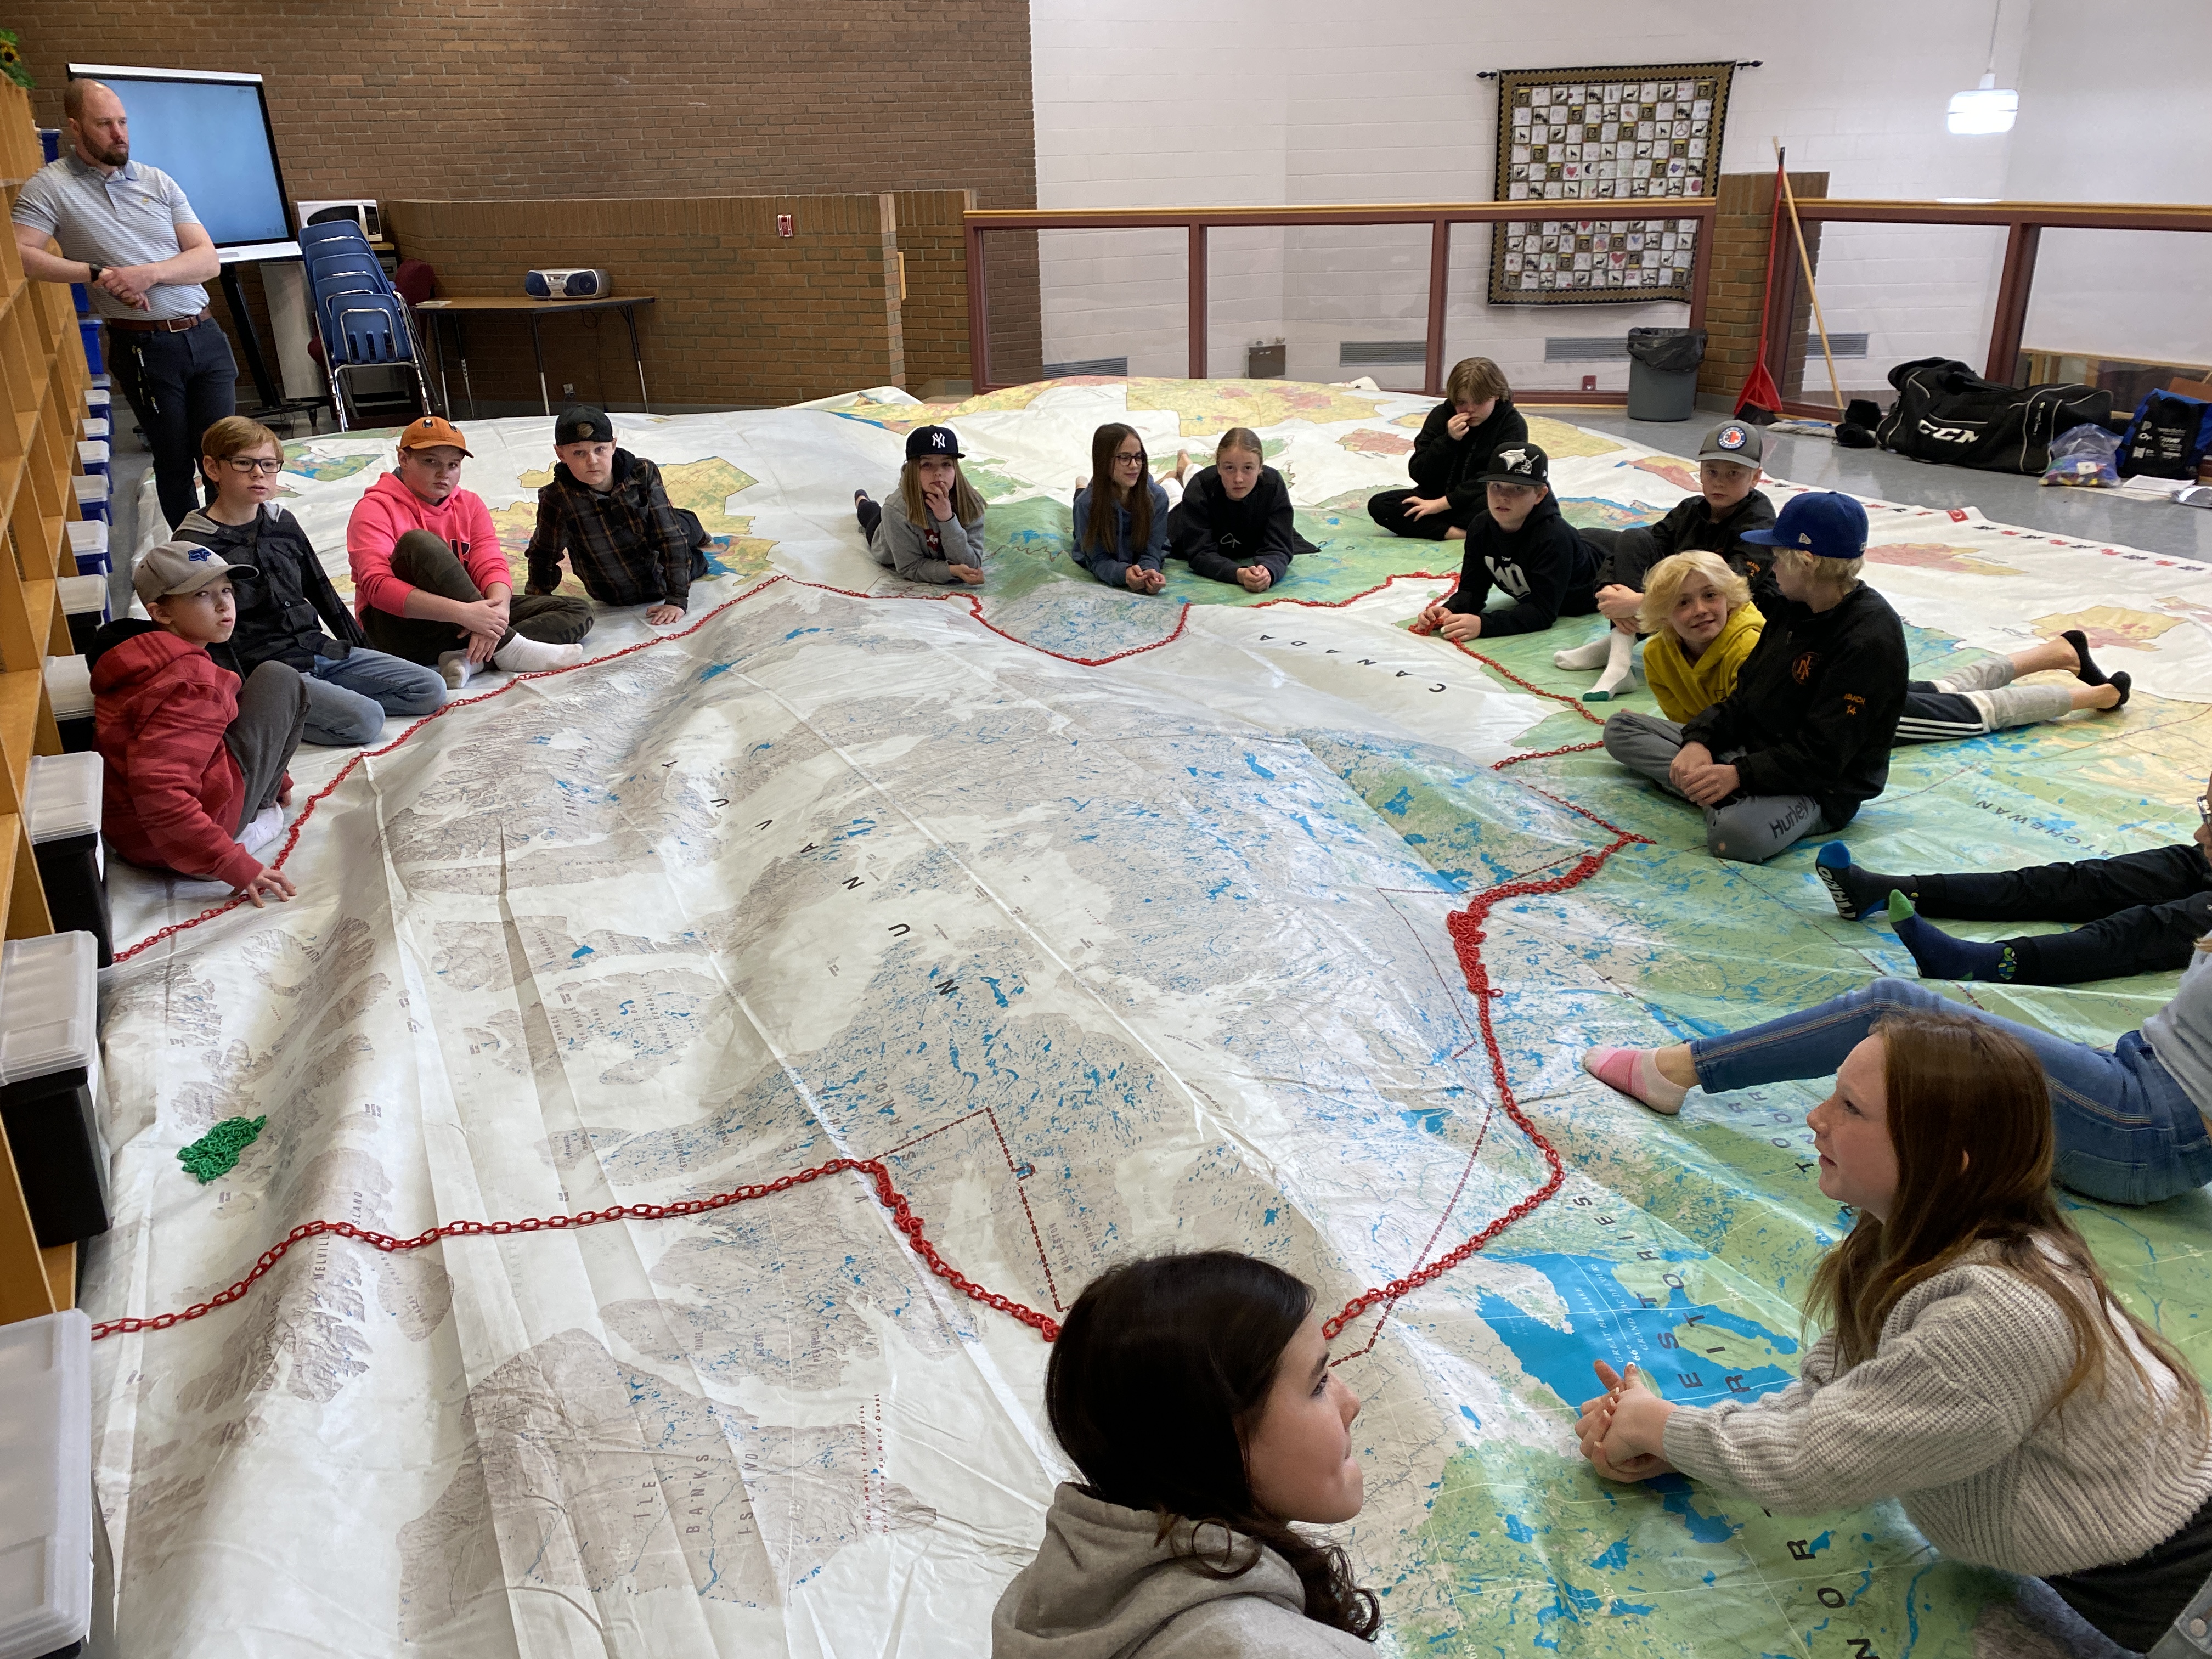
  • Giant Map of Canada: 7 schools, 30 classes, 865 km

Professional Development Learning highlights

  • Attending ASCD for the first time (Denver in March)
  • Learning and presenting at ISTE23 in Philadelphia (June)
    • Receiving the ISTE Silver Volunteer Award
  • Being selected to attend the Google Champions Symposium in Dublin, Ireland (November)
  • Watching dozens and dozens of hours of webinars about generative AI
  • Becoming one of 2 Canadian Ambassador for StickTogether; 

Other interesting things:

  • Hosted BreakoutEDU physical kit games 37 times (and getting to hang out with CEO Adam Bellow at ISTE23 in Philadelphia.)
  • Virtual Reality Sessions hosted: 12 (Oct- Dec)
  • Canva documents created or collaborated on: 127
  • My first full year on Facebook and the start of dabbling in Linked In and Threads
  • In the garden, it was a good year for tomatoes, peppers, cilantro, carrots and beans; it was a dismal year for brussel sprouts, beets, and romaine lettuce.

That’s my professional year of creating and delivering content in a nutshell. Of course, not everything is quantifiable, but the value of a space like this is as a reflection tool. There will be days when I need to peek back here to remember that I am creating content and impacting at least a few folks.

#Giant Map of Canada…back in PRPS

After a great Giant Map of Canada tour with over 17 stops in 2022 (read the highlights here), we decided to bring back another Giant Map of Canada from Canadian Geographic.

Last year we had a political map featuring Canada’s 338 electoral districts. We did many activities beyond politics of course, so I knew that any other map would be equally as versatile. This year we have one of the brand new “Oceans, Freshwater, and Us” Maps – released just this year.

Several of the schools I’ve scheduled with the map are schools that did not get a chance to experience it last year. However, the very first school we took this new version of the map to was a K-3 school where I had been last year. I was amazed at how several of these kids entered the gym and immediately noted that this was a different map than last year. Wow!

This first visit was only 30 short minutes with young learners. I learned lots from my experiences last year, so I did not go into this day with elaborate plans. Instead, we started each group off with “follow the leader” around the outside of the map with the prompts of “I notice” and “I wonder”. For most classes, this led to an authentic opportunity to explore many aspects of the map. I was blown away with the very first thing that a first grade students noticed, rather matter-of-factly: “that the dark blue is where the water is deeper”! Wow. Before I was on the map with students I wondered myself if we would ever get to talking about the ocean depth scale from the legend. With most other groups, students made this observation without any prompting or legend-reading!

Here are some of the other natural conversations that have flowed out of noticing and wondering…

🌎 marine protected areas… what does marine mean? what types of things might need protecting in a marine enrironment? why?

🌎plate tectonics, volcanoes and the Ring of Fire in the Pacific Ocean

🌎 The wild ponies of Sable Island

🌎 The coordinates in the Atlantic Ocean where the Titanic sank

🌎Iceberg Alley

🌎 Different countries that border Canada: USA, Russia, Denmark (Greenland), Iceland, and France (St. Pierre & Miquelon)

🌎 Provinces, and where students have lived or visited

Once our wonderings and noticings wane, and students get a bit restless, I have a great activity from last #GiantMapofCanada adventure where we investigate basic map features (compass, legend, borders, river, ocean, lake, island… and for students who are bit older I add peninsuala, straight/channel and bay).

I am such a geography nerd. Maps are my happy place. This particular map has several other features that I hope will come up such as First Nations reserves and the First Nations languages.

Other lessons and conversations will hopefully occur around rivers and watersheds.

And, this map also comes with some incredible AR content! If you are interested, you can download the Canada Oceans Week App and do some wonderful exploring without even being on the map.

#GiantCanadaMap in Southern Alberta

Here is a summary of the Giant Map around Prairie Rose School District in March 2022:

Number of sites visited: 17 (= 17 times packing and unpacking!)

Kilometres travelled: 2552 km

Classes visited: 62 different groups

Click the buttons above to read about all of the activities that I tried out with the giant Canadian Political Floor Map of Canada. There are lots of stories of fun things that we did as well as changes to activities that I made along the way to improve the flow of map experiences.

The map we had was a “political map” which featured the 338 political ridings in Canada, but I chose it as it also showed provincial borders, as well as topography and vegetation cover, making it versatile for a variety of acitivities and curriculum connections. Keep reading for some of the activitiy highlights.

Residential School Sites

The first time we did this activity at Foremost School, Mrs. Hazell’s grade 10 students had written residential school names, dates and approximate # of students on different coloured papers for each province. This was the first of many times that I was impacted by this activity, even though I know lots about the history of residential schools. The coloured paper for each province was a brilliant idea and thanks to Mrs. Hazell, I gathered my own coloured paper for when I would repeat this activity with Junior High students at two other schools. In the foreground of the image below, there is a lone light pink coloured paper on New Brunswick – the distinct coloured paper per province led to many thought provoking questions about the location and distribution of these schools across Canada.

Nunavut is big: provinces and sizes of federal electoral ridings

Nunavut is big – outlined with the red chains above.

With almost 2/3 of the lessons with the giant map, we use the plastic chain markers (that come with the map) to trace the outline of Nunavut. Nunavut is BIG.

For younger students, this is just a fun part of reviewing the provinces/territories of Canada. For older students, I use this same activity in our discussions about representation by population. On average, each of Canada’s electoral districts represents approximately 100 000 Canadians. Before outlining Nunavut, we look at the Greater Toronto Area with its 6.7 million population and approximately 60 electoral districts, including Canada’s geographically smallest riding of Toronto Center. At just 5 square kilometers it has 120 000 people and is about the same geographical size as the small towns that our schools are located in. After this, we work together to outline Nunavut, and a student usually makes the observation that this whole area is only one electoral district. But wait… there’s more. The entire population of that huge Nunavut is around 40 000. This leads to some great discussions about Canada.

Grade 2 Social Studies Communities (and animals)

In Alberta, grade 2 Social Studies students currently study three Canadian communities: one from the prairies (often Saskatoon), one from the Maritimes (often Meteghan, New Bruswick), and the northern community of Iqaluit, Nunavut. For grade 2 students, it is quite exciting to actually plot these communities that they have been studying on the giant map. img_1811
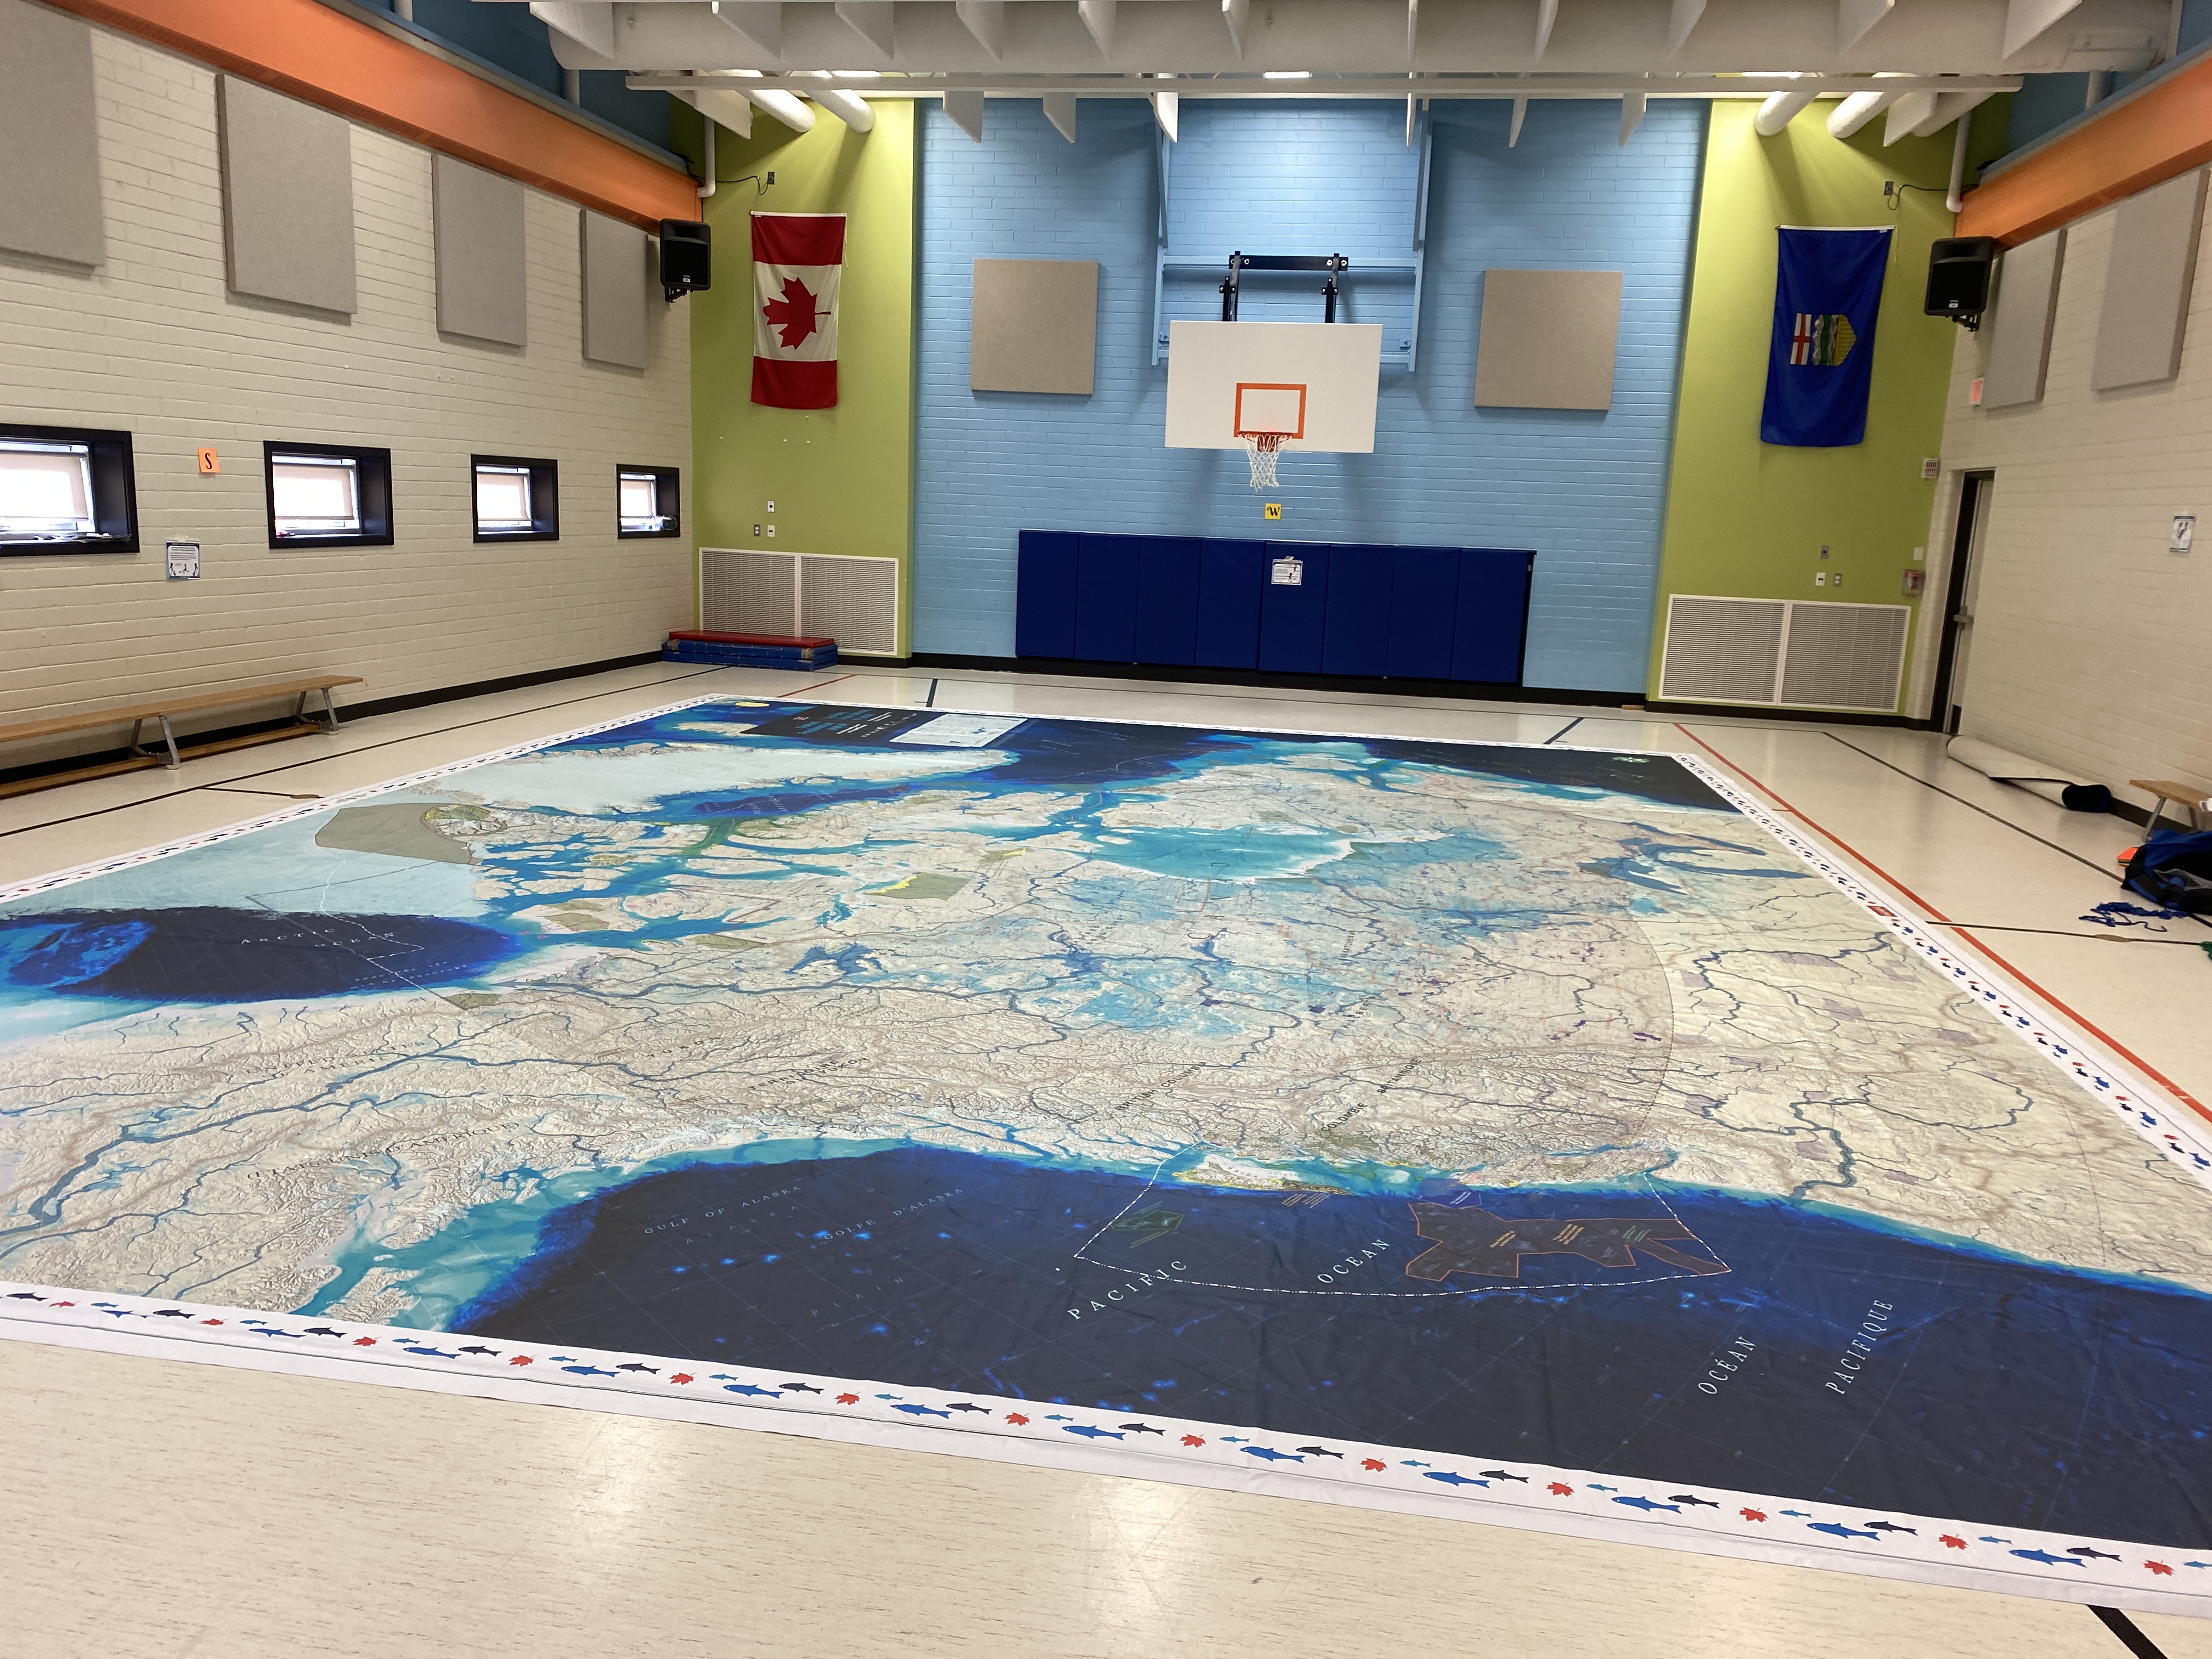
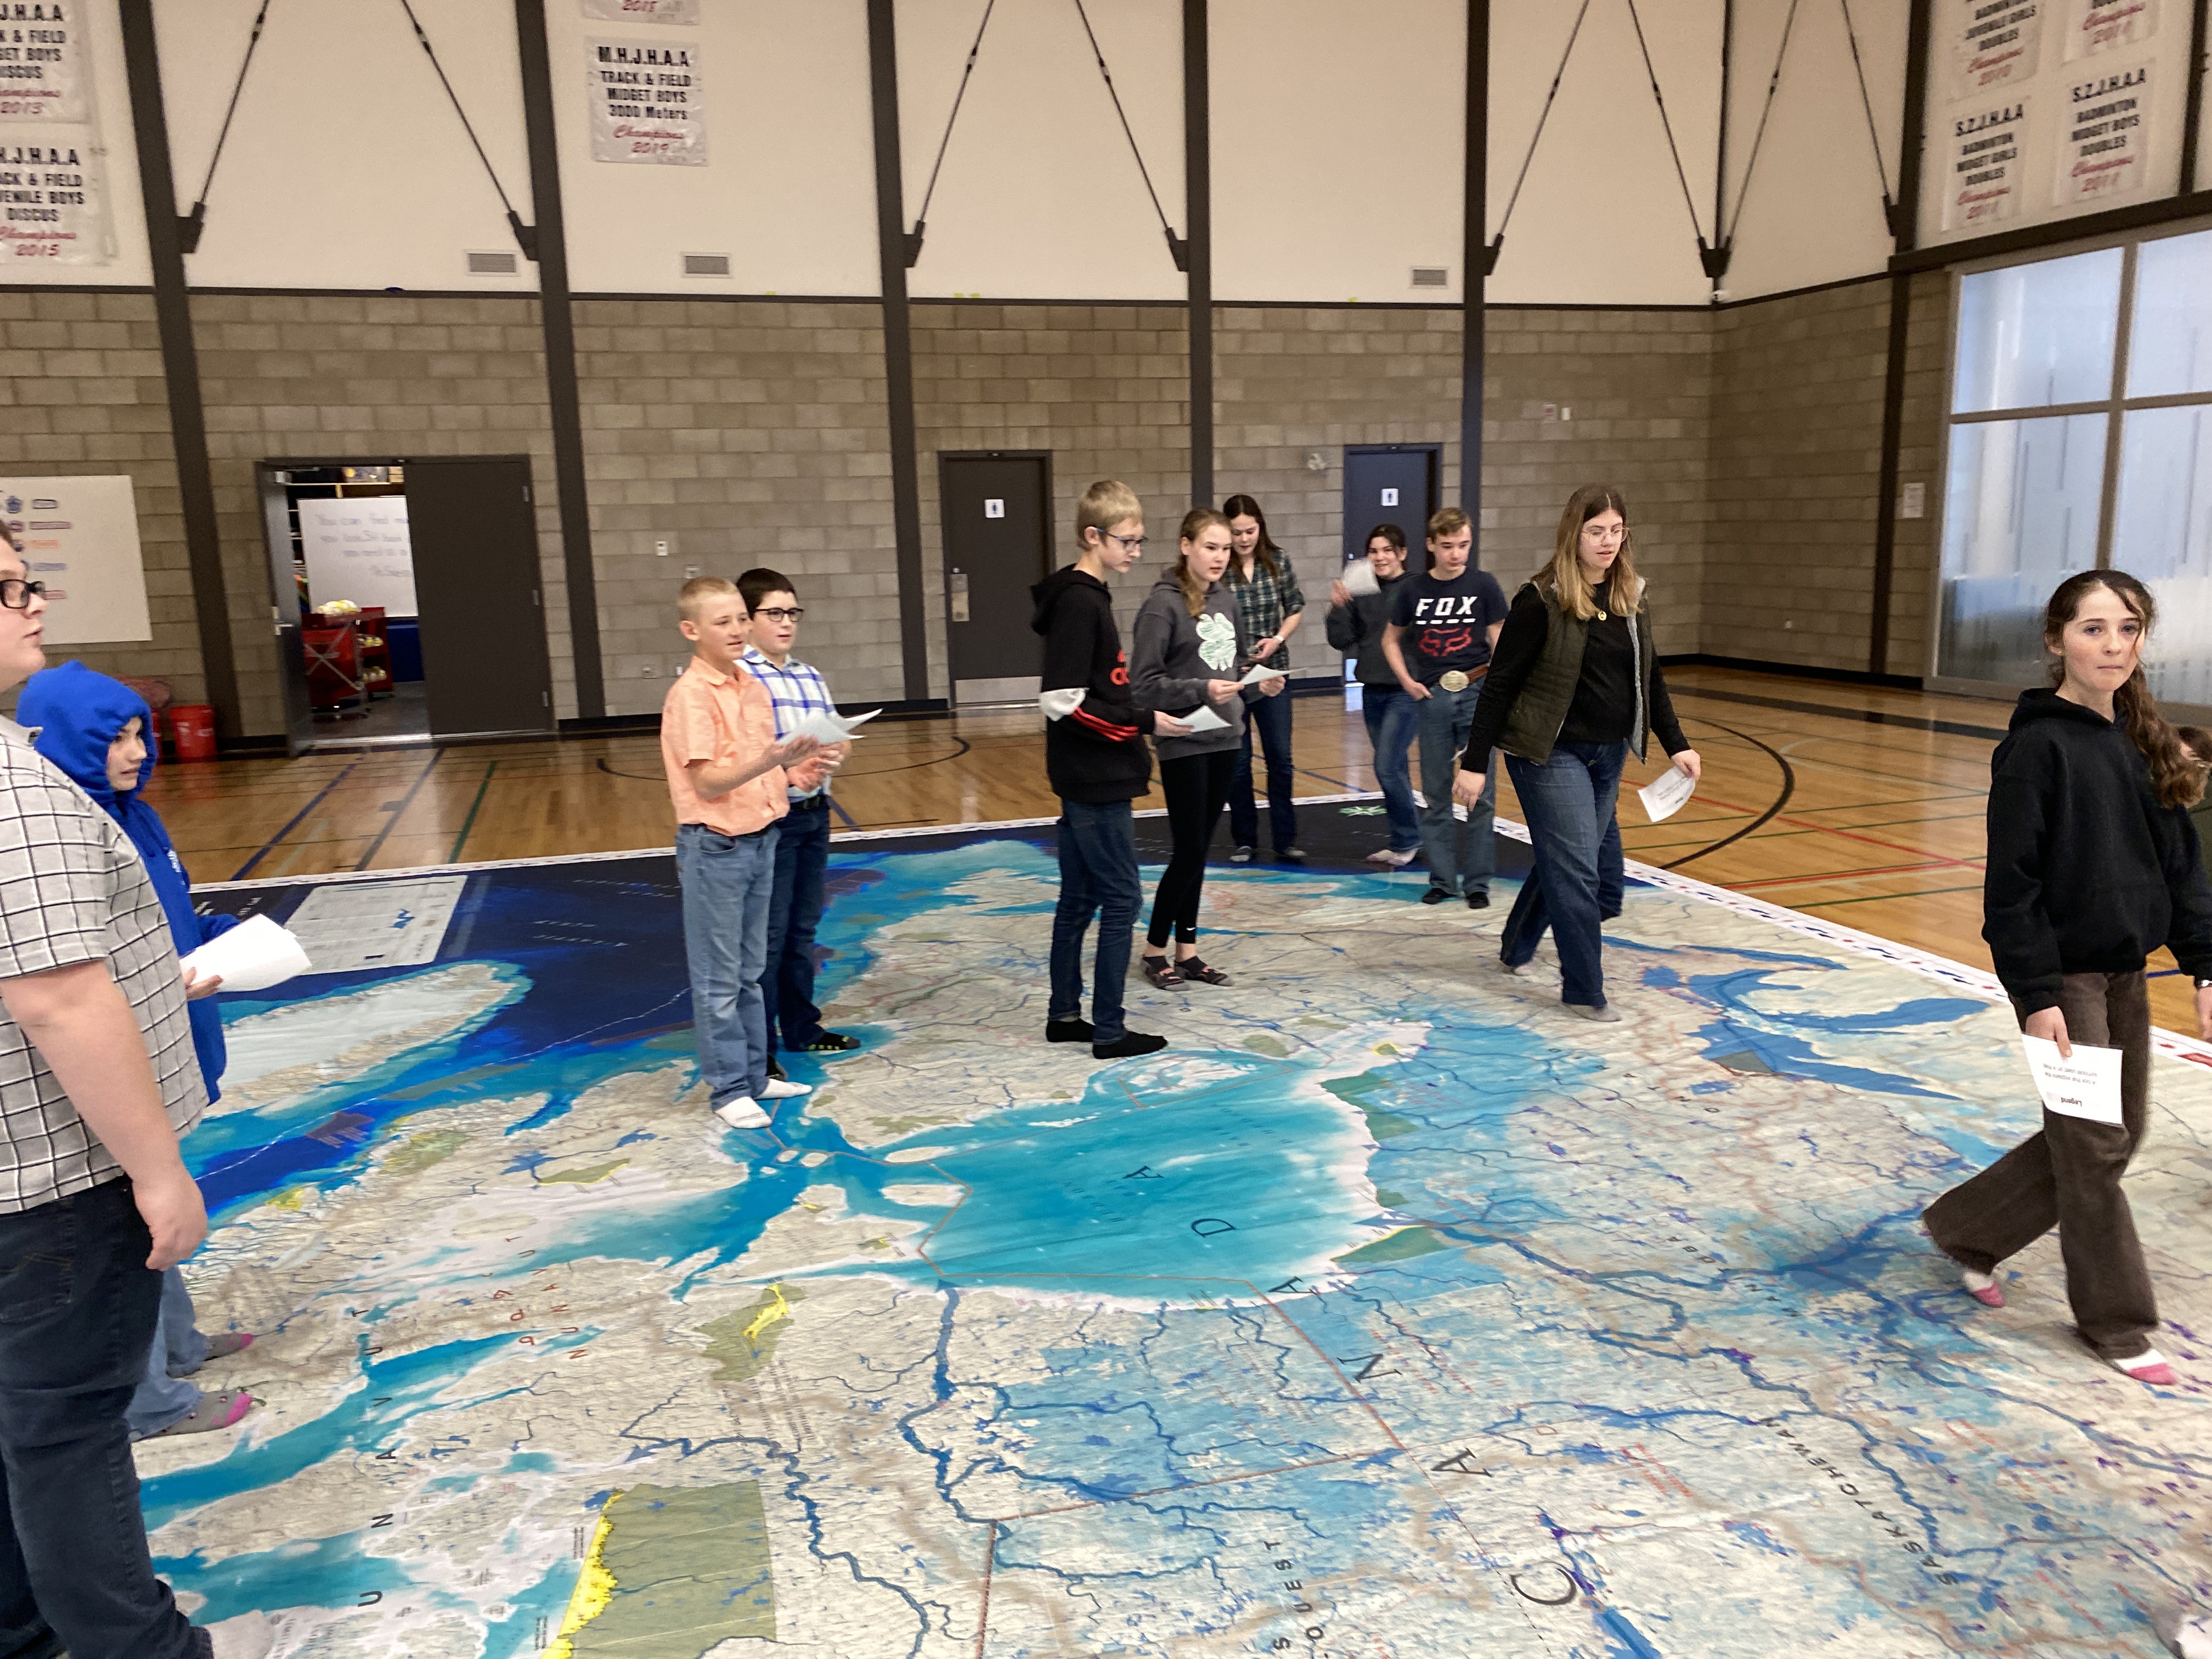
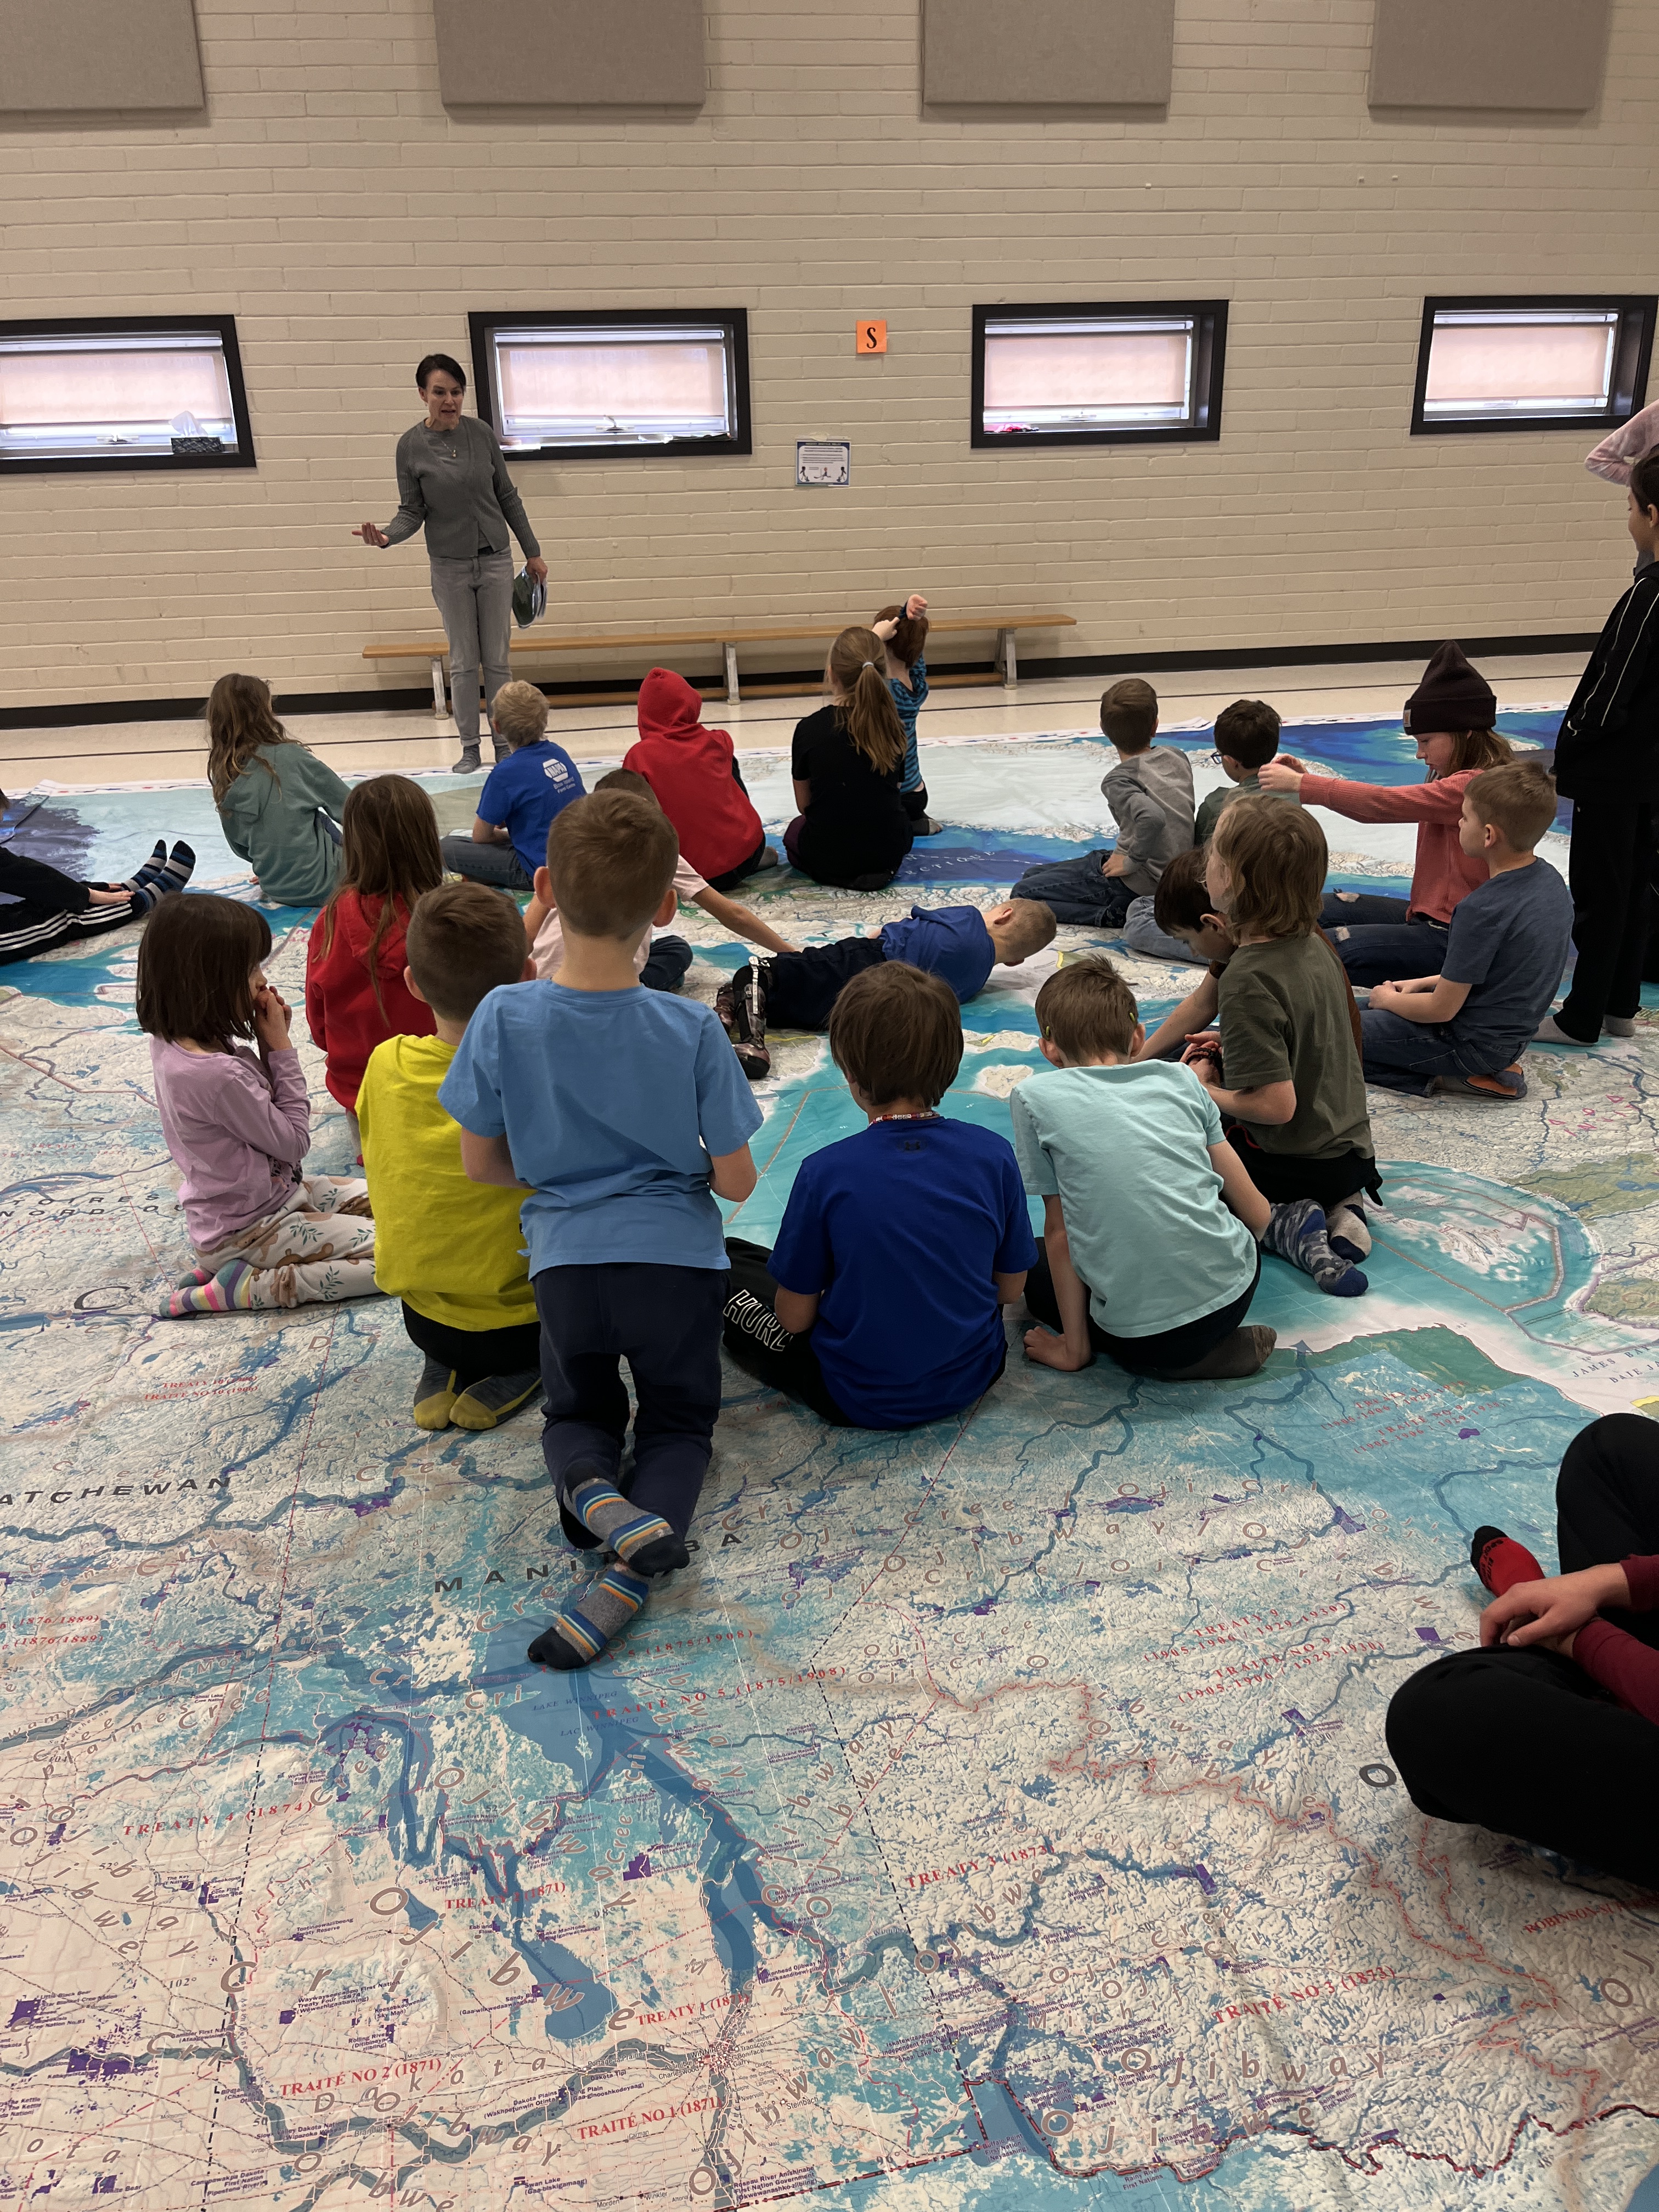
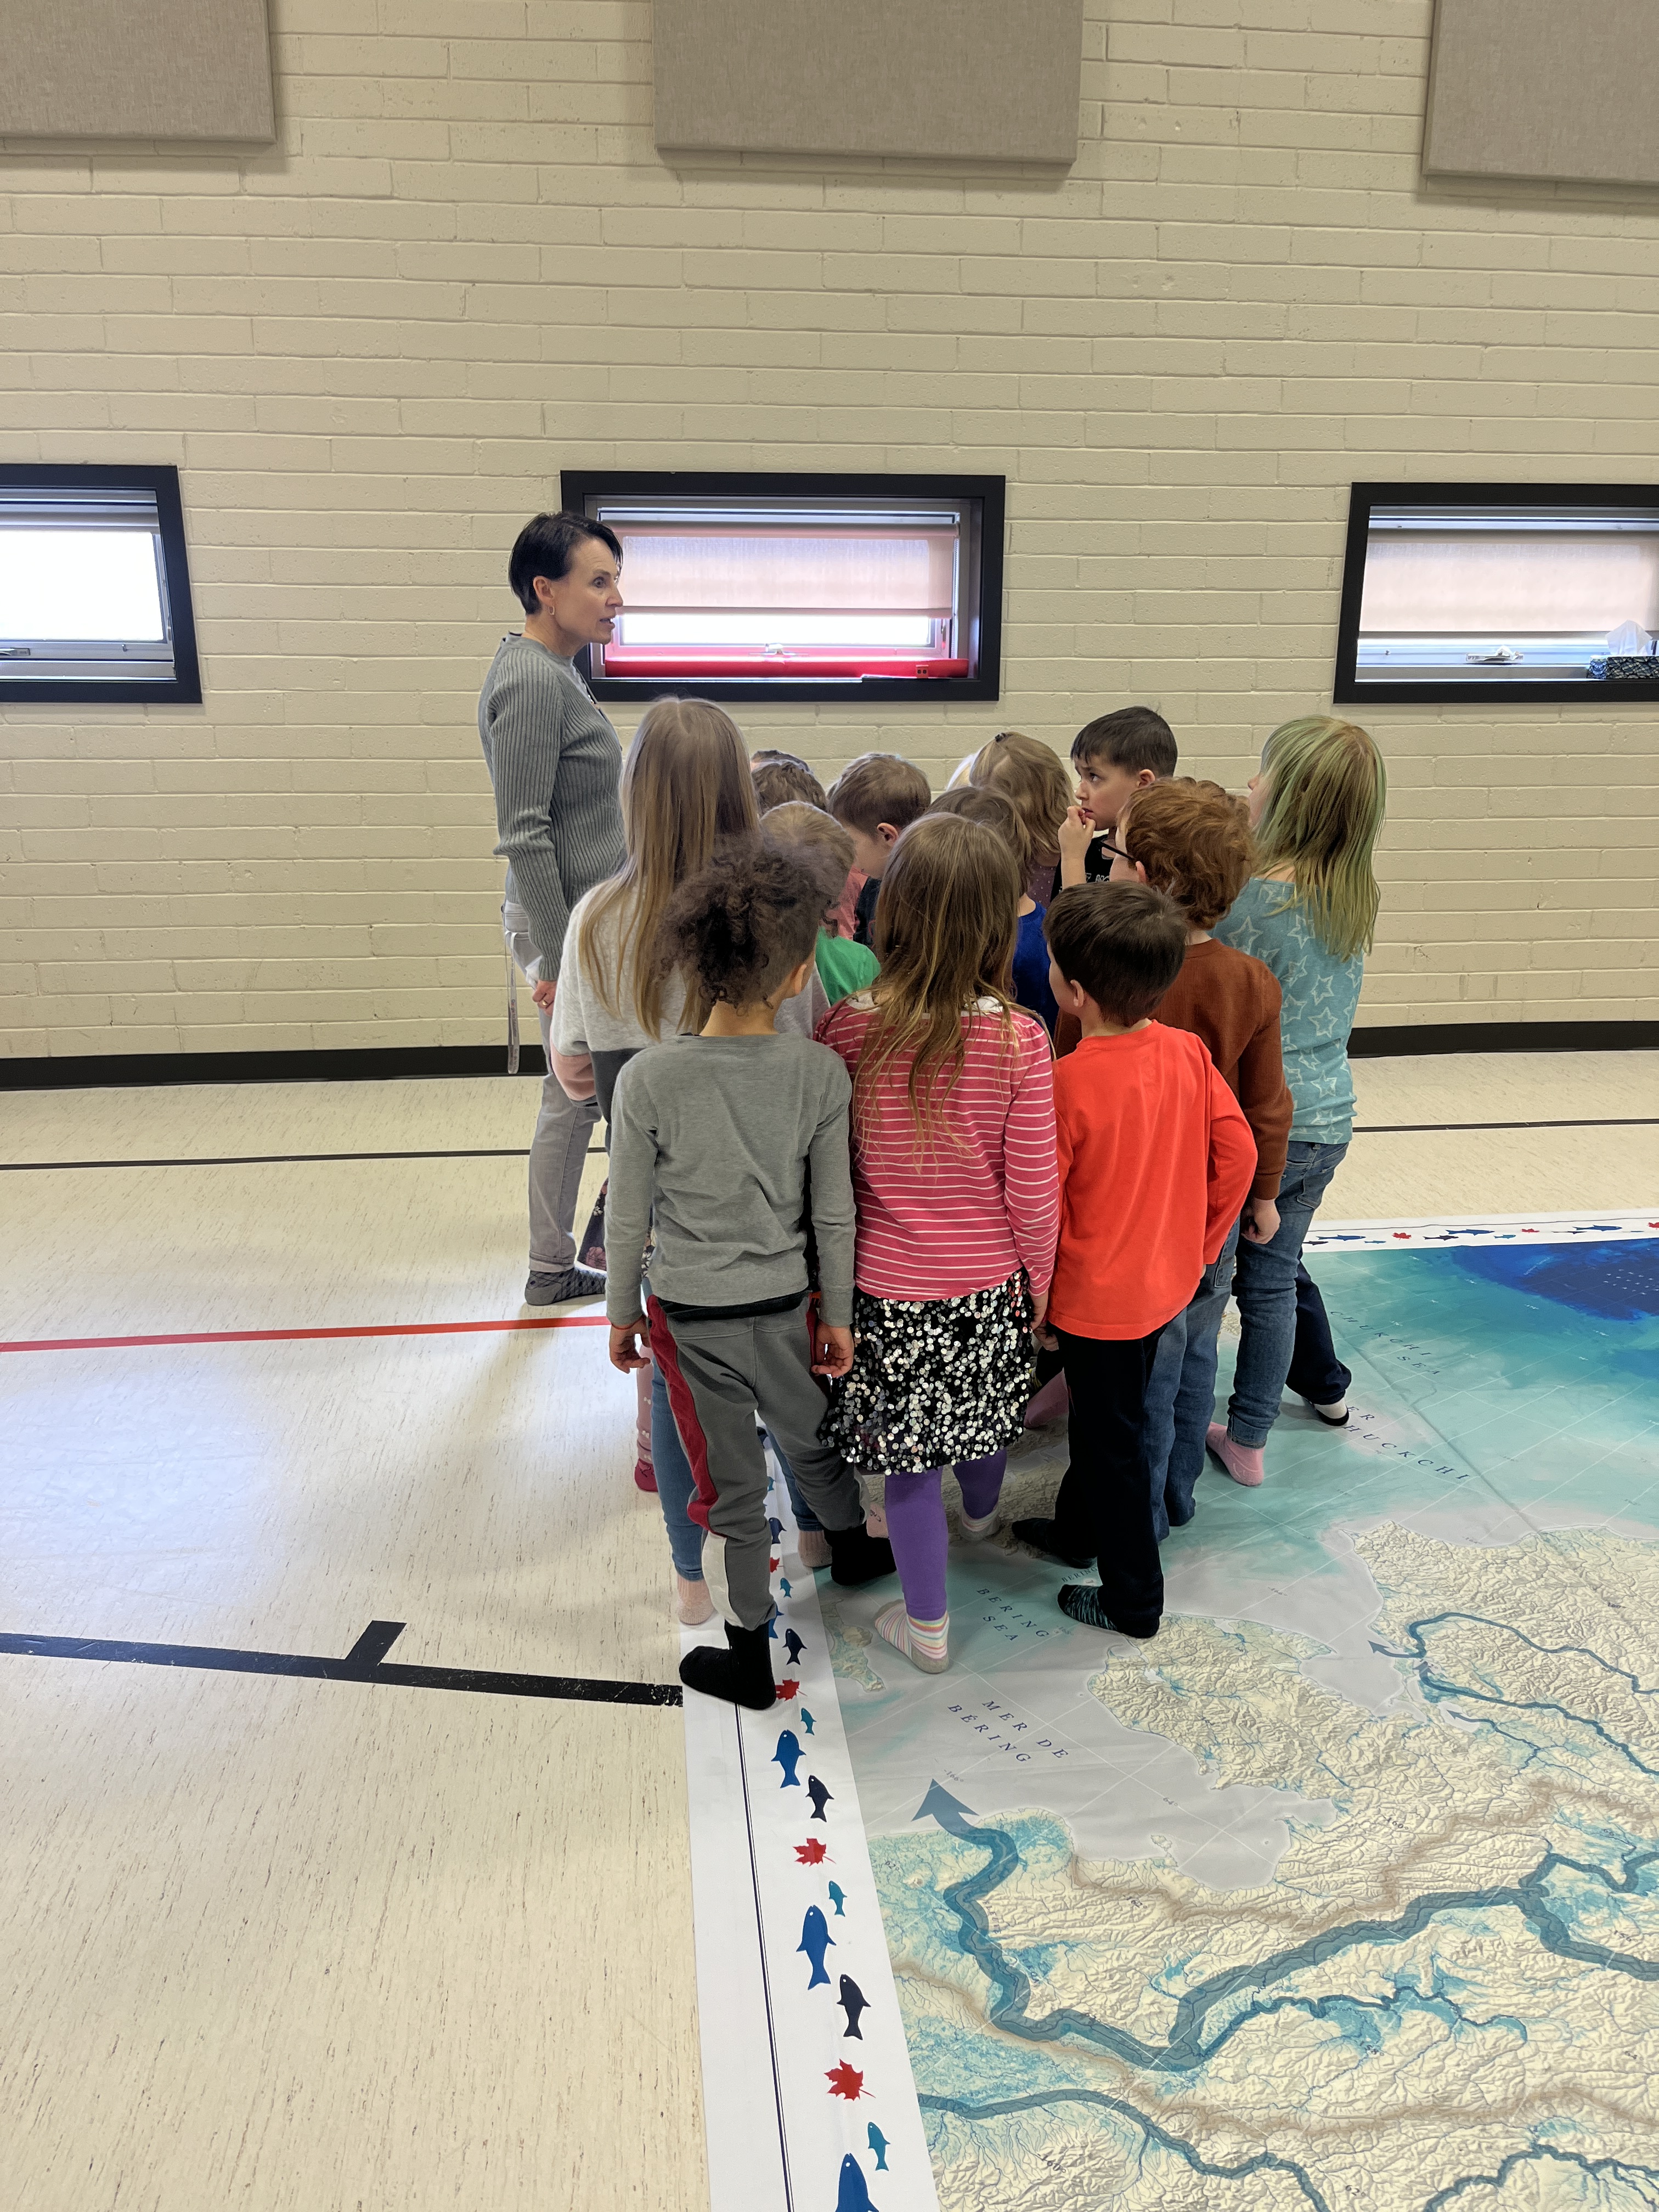
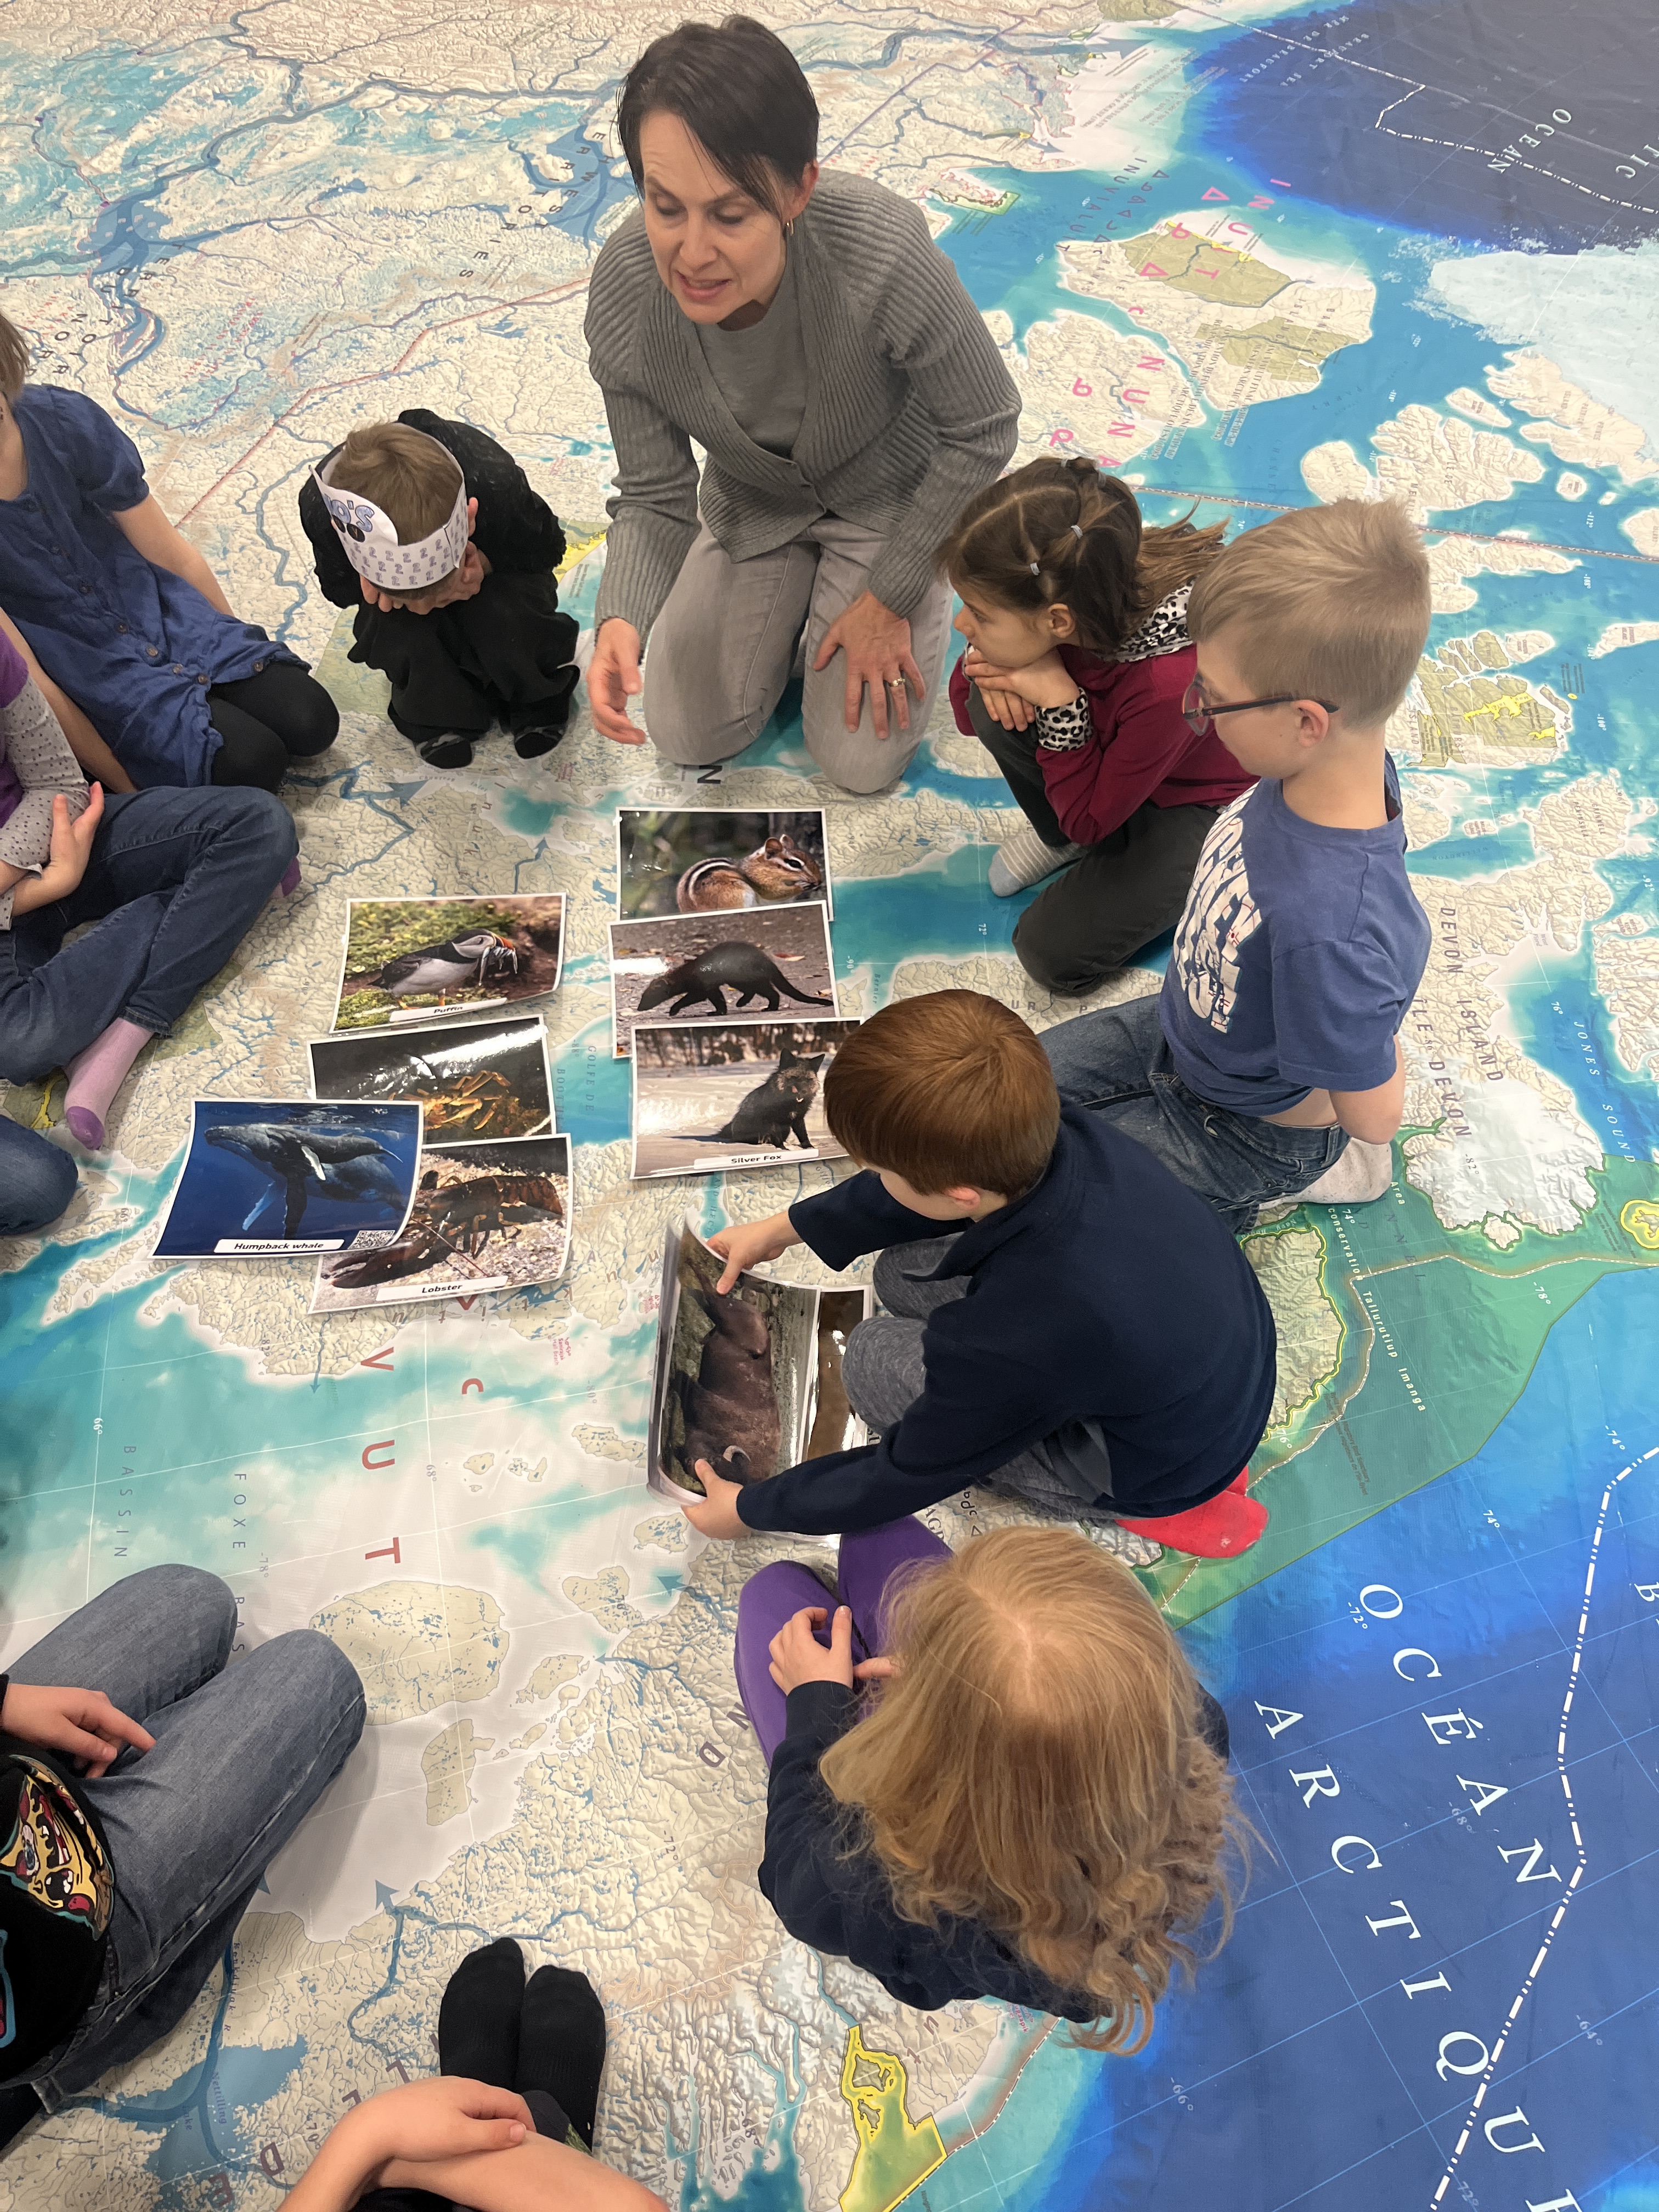
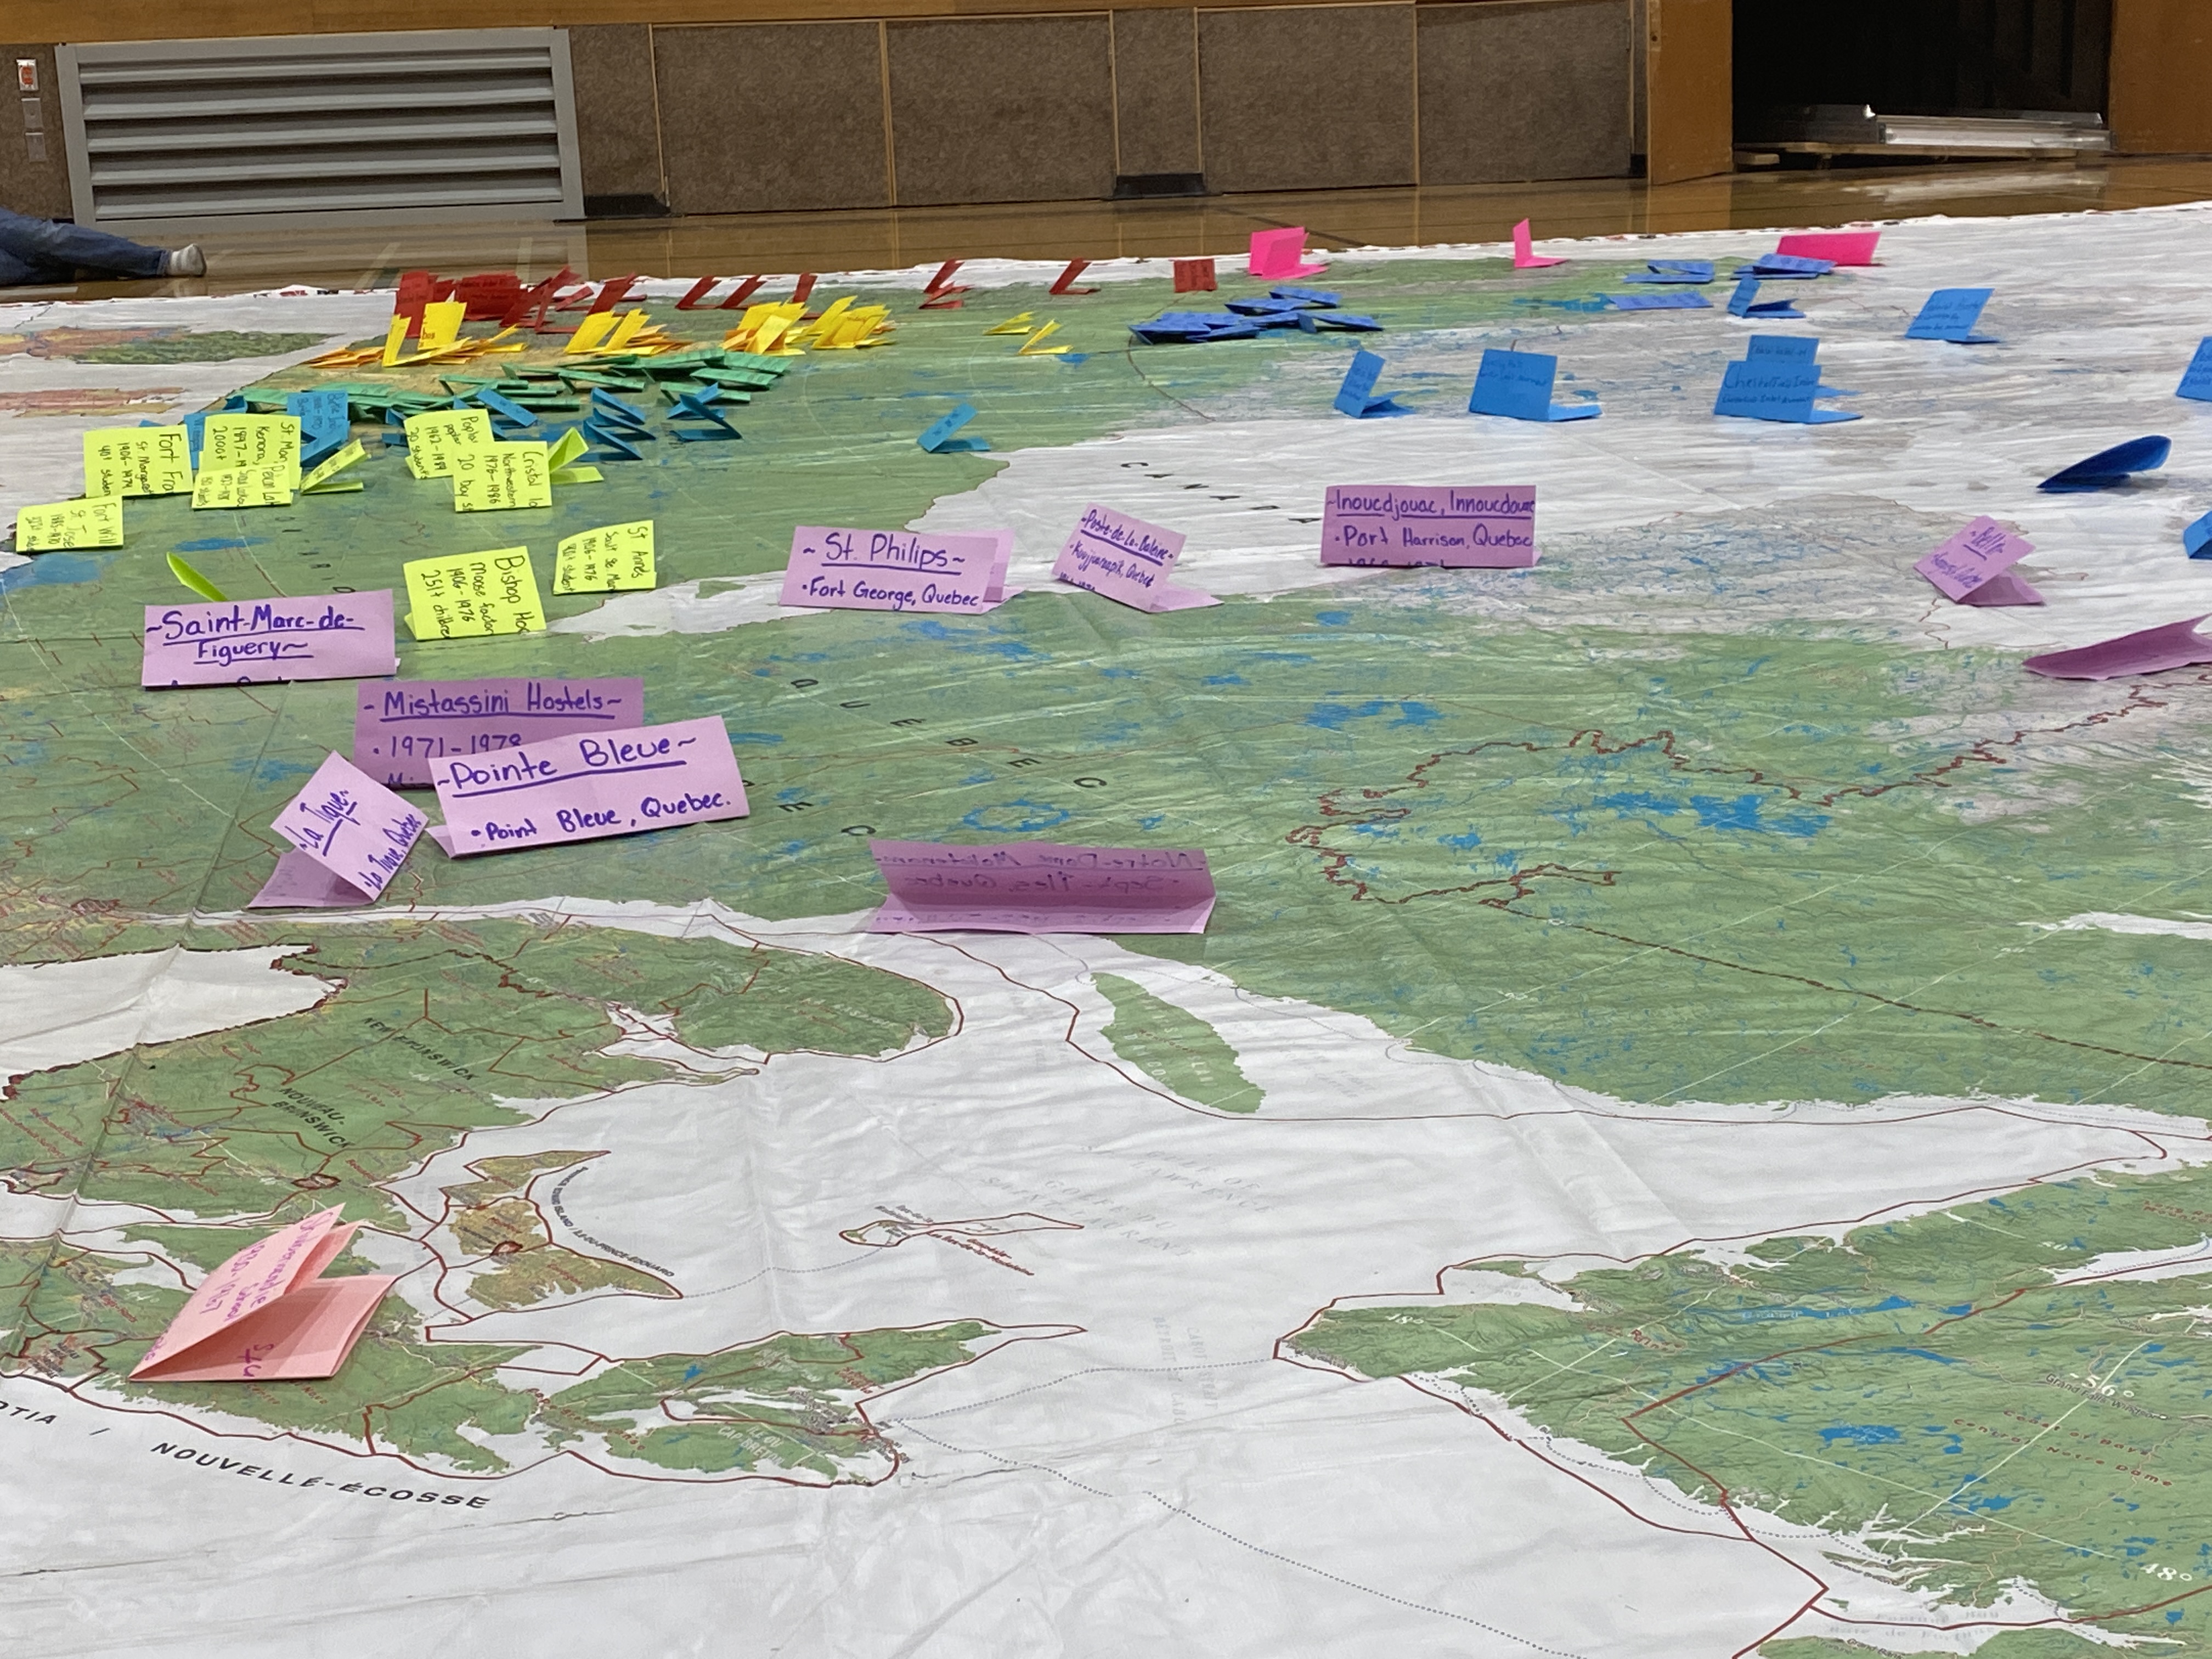
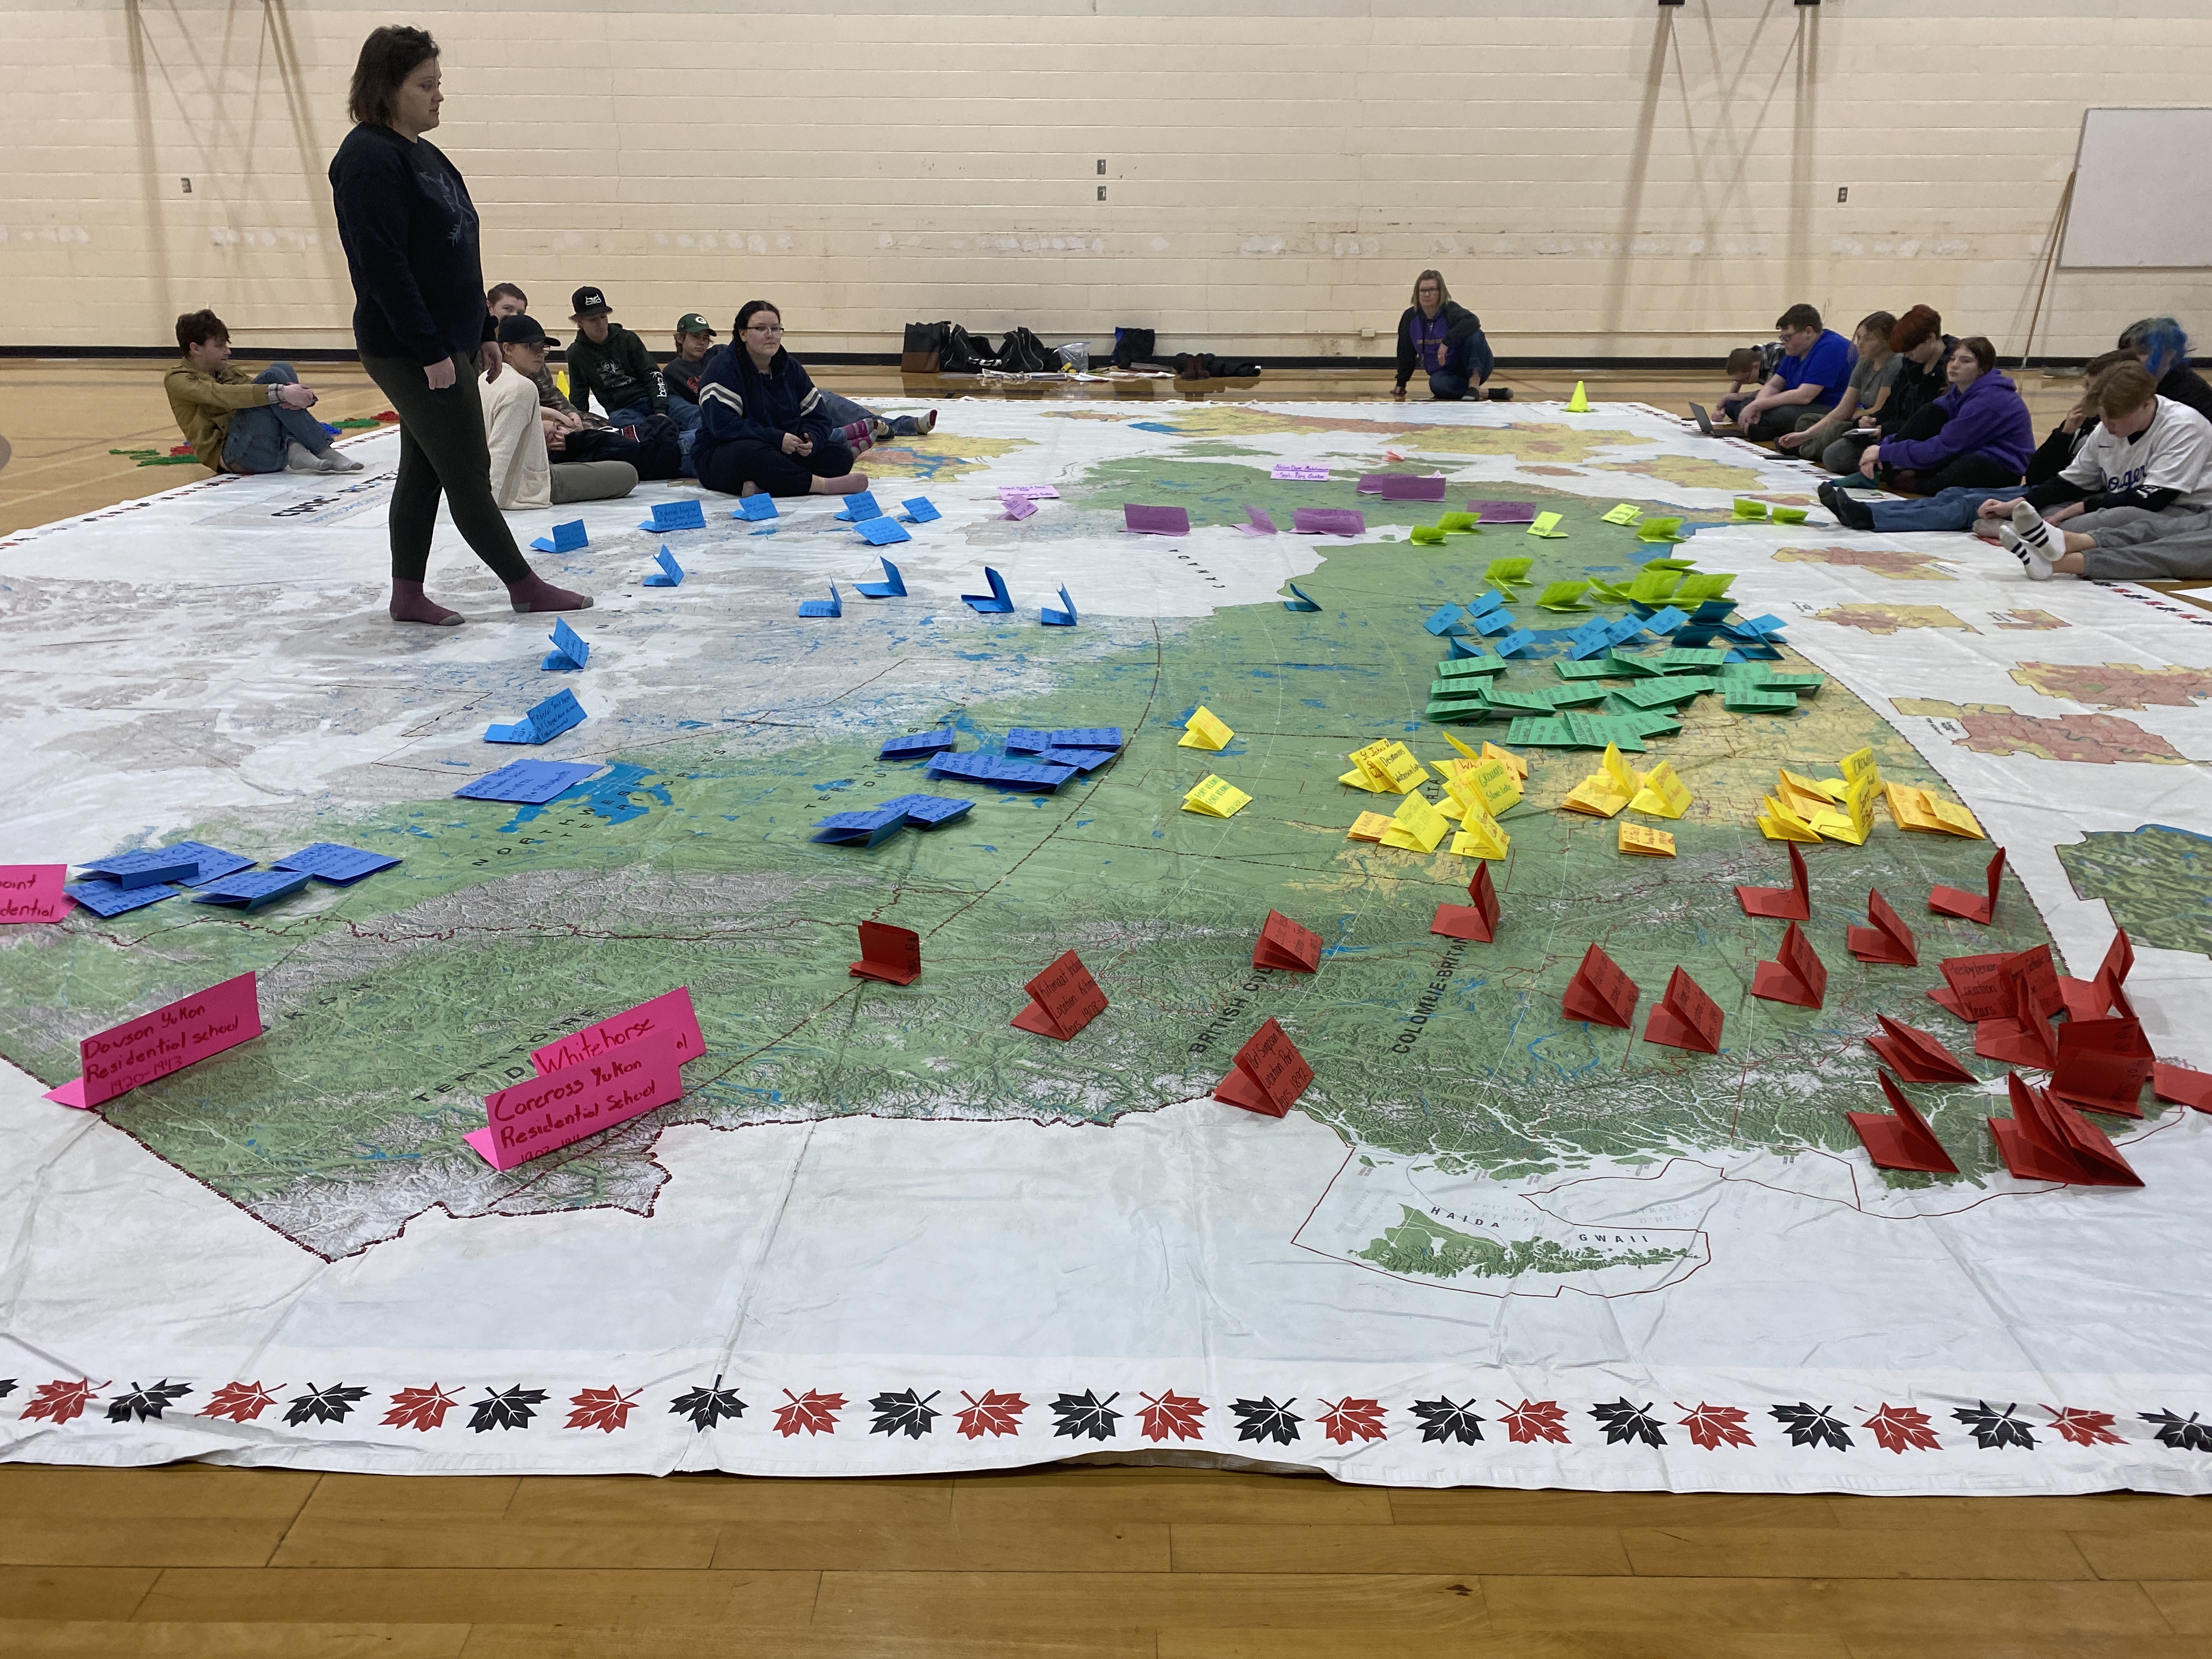
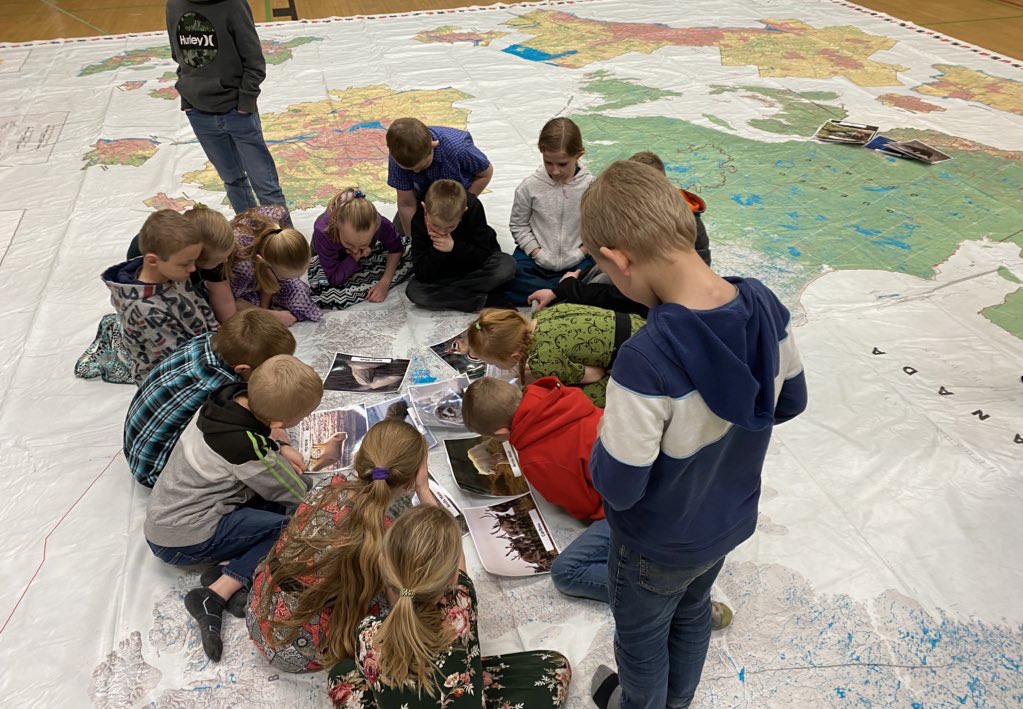
Then we use the legend on the map to identify the different vegetation cover at each location, and finally we gather around and do an animal sort of about 20 different animals that would be native to one of the 3 communities. This often leads into a student obervation about the colours of animals from the regions (eg. Nunavut=white; Prairie = brown/yellow) and a great science conversation about adaptation. 

Math: Calculating distances with scale

The original lesson plan idea here came from the lessons of the Natural Resources giant map. I have the grade 6 or 7 or 8 teacher review ratio and scale with students so that . Each student then has a white board and marker as I model how to measure the distance in cenimeters between 2 locations on the map via transportation routes. img_1830
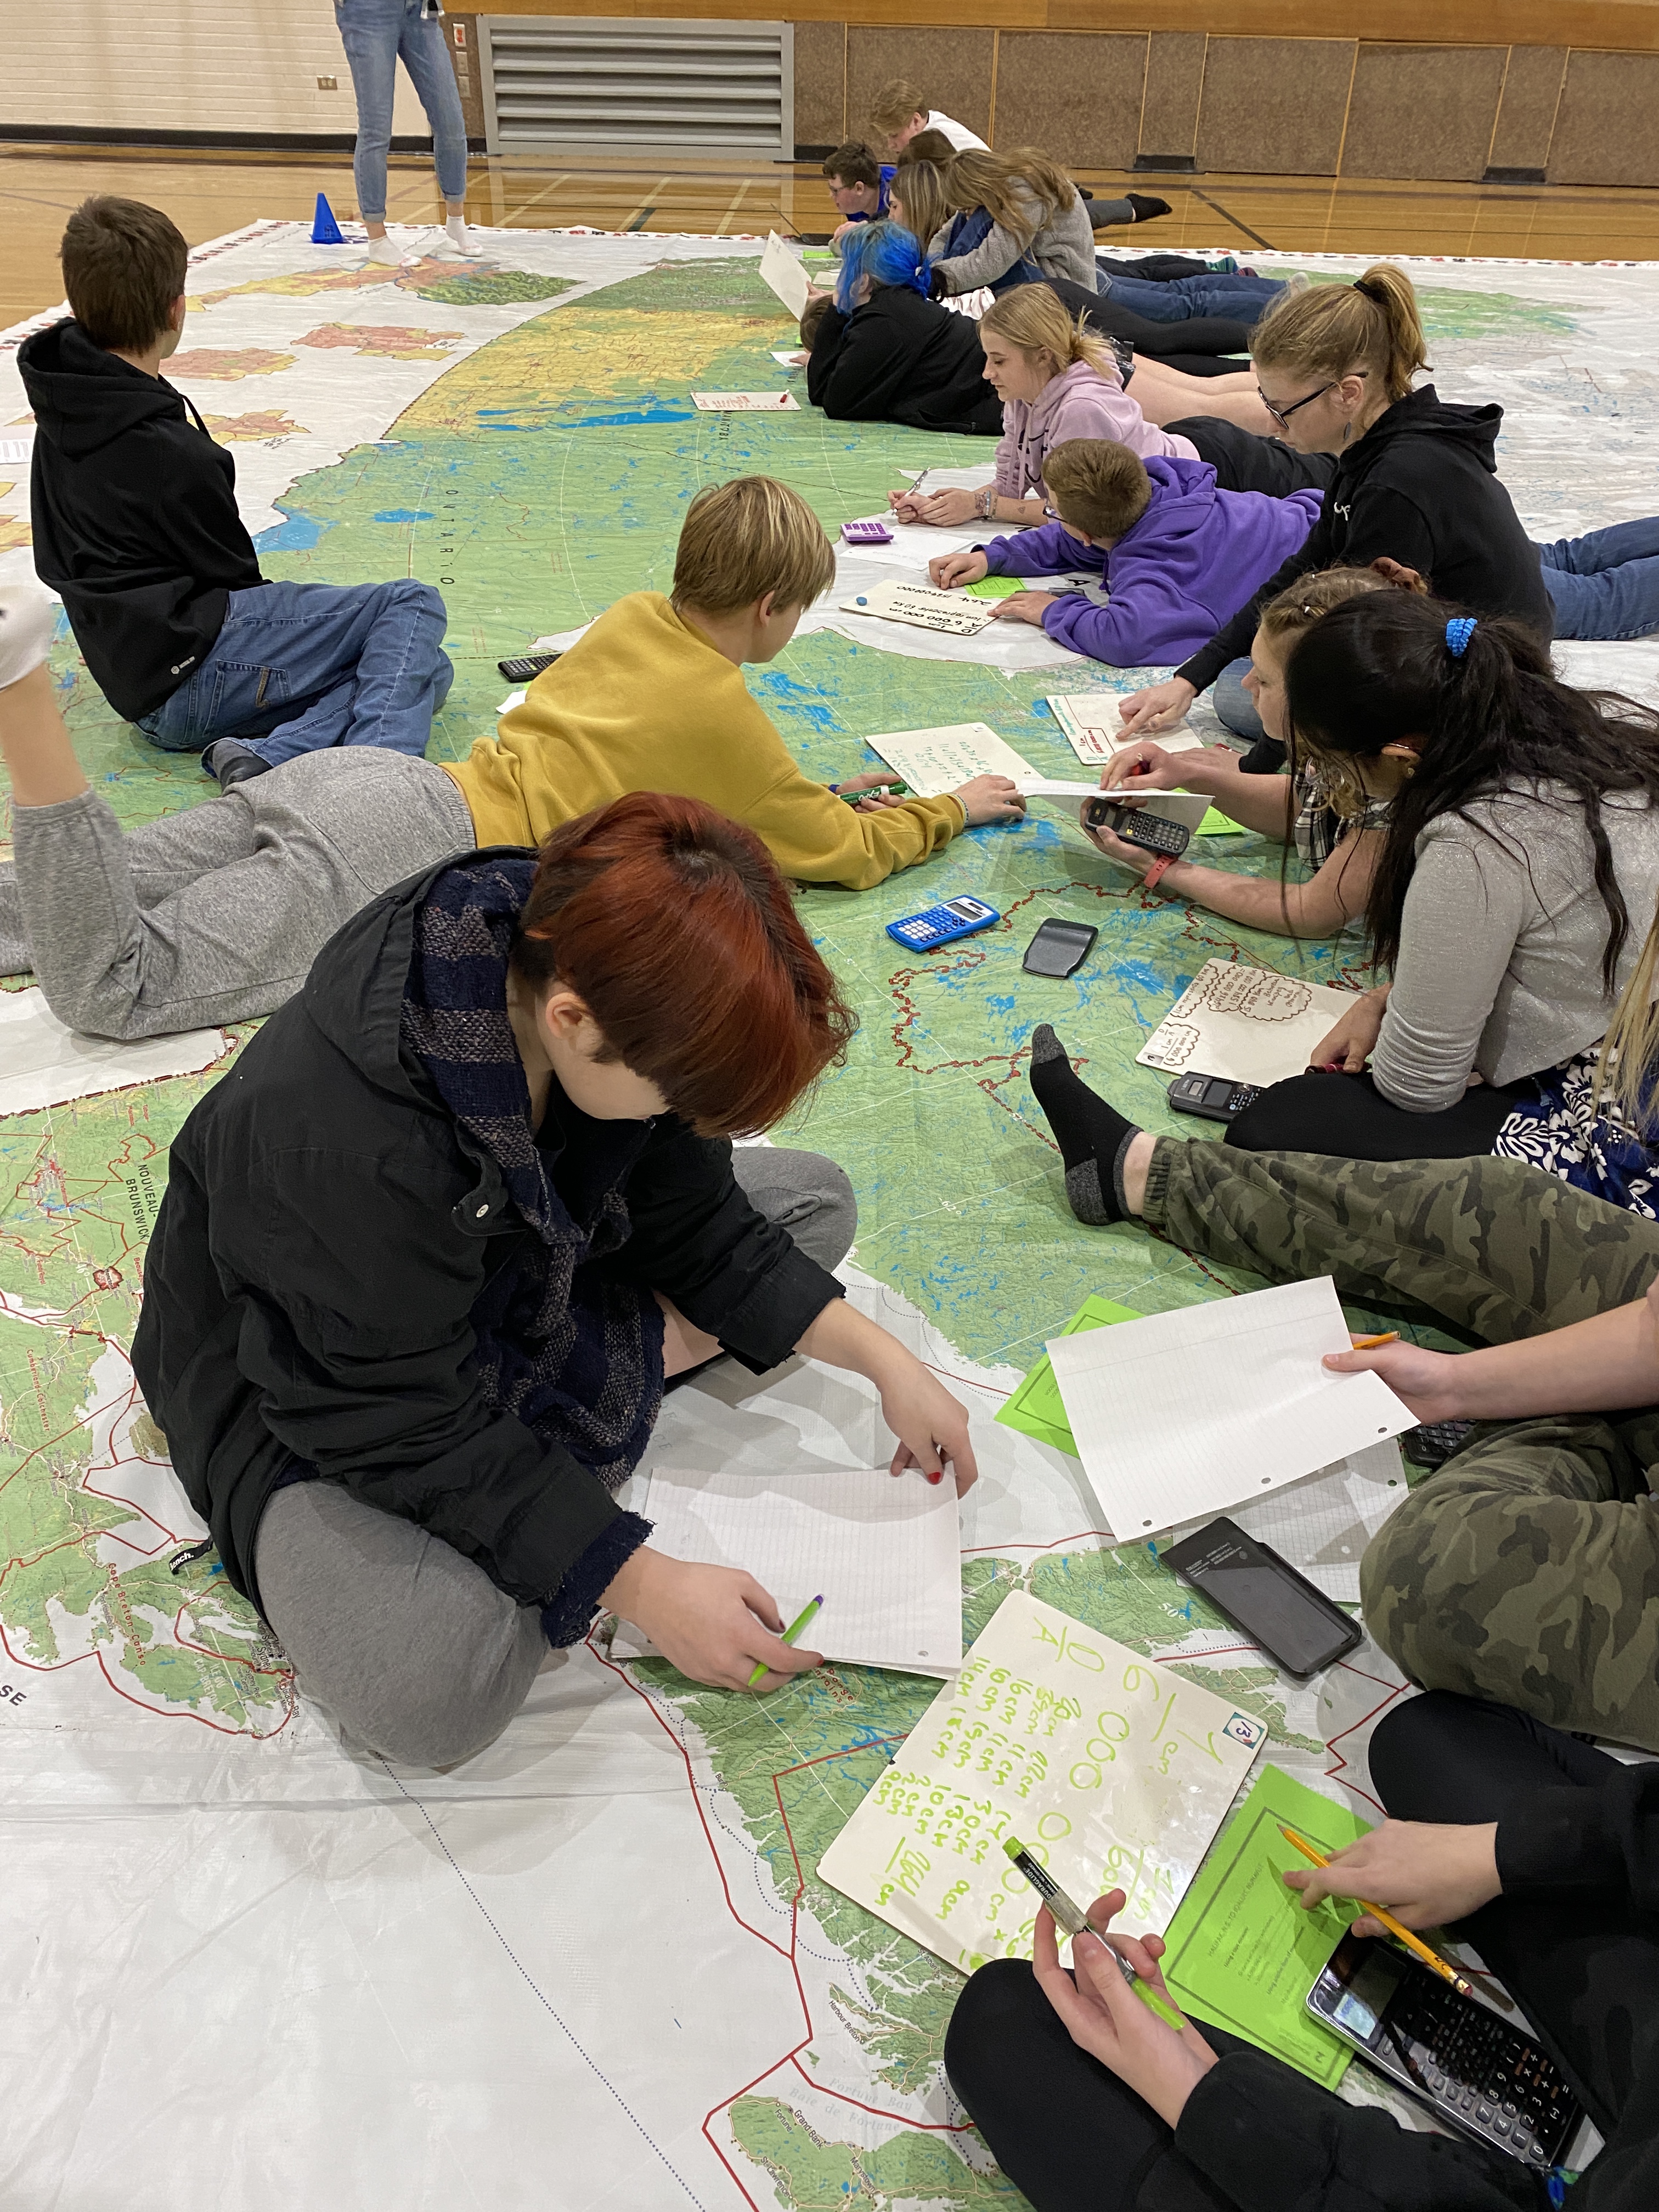
They add up the numbers as I fire them off and once we have a total we use the scale to calculate distance and eventually get to kilometers. Student pairs then get assigned two locations and they have to measure and then calculate the distance between the two using transportation routes.

Latitude and Longitude + Energy Sources

Another lesson plan from the Natural Resources giant map has about 80 images of power generation sites across Canada with corresponding latitude and longitude. When I’ve had a longer session with students in grade 4 and above this makes for a good add-on to one of the activities above. It always has to start with a mini-lesson on latitude and longitude as students typically do not know these terms or have only been introduced to them briefly. After modelling how to place a few of the location cards, each student pair gets 3 cards to place using lattitude and longitude. At this point, the teacher usually thinks that will be too many, too difficult, but within a few minutes, students are coming to ask for more cards to plot, and it doesn’t take long until we have the map covered. In a perfect world, we have time to make observations about locations of energy production in Canada, but often this activity ends while we are finding the locations and the students leave with a very hands-on experience with latitude and longitude. Yay geography!!

Day 8: Giant Map of Canada

Day 1 Day 2 Day 3Day 4 Day 5 & 6

Classes on the map today: 6

Plotting Voyageur route from Atlantic Ocean to Alberta

School: Irvine School; K-9 with approximately 280 students

What I learned today was that a longer period of giant map time allows for activities to be more successful. At Irvine School, the fourth-grade classes had each booked a double period and there were single time 35-minute slots with two sixth-grade classes, a fifth-grade class and a 1-2 split class.

When I realized that I was getting a double period with a small grade 4 class with only 12 students present today, I knew that this would be the perfect opportunity to retry my grade four scavenger hunt/puzzle of our province, Alberta. This especially worked since this class came with the teacher, an education assistant, and a preservice teacher. We had time to do other curriculum-related activities like use the plastic chains to plot the voyageur river routes from the Atlantic to the prairies.

We started this grade four scavenger hunt activity with a mini-lesson on latitude and longitude. On this map, the latitude and longitude lines are identified by even numbers, so every second degree gets a line. The students had been introduced to latitude and longitude previously, so as they worked in pairs, usually at least one student could work out the clues. Clues relied on latitude and longitude, and two independent maps with additional locations named, such as provincial and national parks. The answers were guided by fill-in-the-letter spaces; each answer had a letter in a box that would contribute to a final word clue. The grade four Social Studies curriculum focuses on Alberta, so all clues were in Alberta.

The ultimate issue with this activity is space. With enough time, the clues are a challenge but are realistic. With 12 students in this class trying to work in the Alberta space on the map, it was tight, but JUST worked out.

Plotting latitude and longitude locations of electricity generation in Canada

When the next grade four class came with twenty students, I knew that space-wise, the Alberta activity was not feasible. As this class also had a double period with the map, I took this opportunity to do an activity that I hadn’t yet had time to do. I have a set of about 75 ‘energy’ cards from the Natural Resources map lesson plans. Each card lists the town/city and province of an energy source, but also lists the latitude and longitude along with a picture. So after another mini-lesson on latitude and longitude, the students used the entire map to place the energy cards around the map. Each pair started with three cards. Most groups caught on quickly and were back for more cards. We placed all of the cards quite quickly but ran out of time to discuss and ask questions about patterns that emerged. This part of the lesson met my primary objective: practice identifying latitude and longitude as well as identifying the location of provinces.

The federal riding of Nunavut – 1 Member of Parliament representing approximately 40 000 people

Sixth grade is the real sweet spot for this map as the Social Studies curriculum covers representative democracy. Even though the curriculum focuses on municipal and provincial levels of government, many teachers also touch on the federal level of government terms. Both our provincial and federal levels of government are elected by representation by population, so this map, with its federal electoral district markings leads to a GREAT discussion about representation by population. Especially striking is the size of Nunavut and the fact that they get only one federal representative. Marking out the boundaries of Newfoundland (see image) is always a powerful activity so I try to work it in to most of the classes that come to visit the map.

Day 2: Giant Floor Map of Canada

On Day 2 of the giant Canada floor map in Prairie Rose, the map travelled to Foremost, Alberta. This is our only K-12 school, so it is not surprising that it had booked the greatest age range of student experiences.

The version of the map that we have is the Canadian Political map that shows all 338 electoral districts in Canada. The larger-scale city insets that are around the edges of the map do cause a bit of confusion for the younger students who struggle to differentiate between the actual Canada and the insets. Fortunately, they kind of look like puzzle pieces, so during certain activities, I can tell the littles that have to find “x” that isn’t on “a puzzle”.

One of the reasons that I chose this map was that it had distinct provincial borders and also showed some physical features such as forests, agricultural land and barren or snowy land. This makes this map quite versatile and so I drew from the online lesson plans that were available from other giant maps on the website at Canadian Geographic Education. In addition, I’ve created some of my own lesson plans.

Biggest Impact

So even though we didn’t have the Indigenous Peoples Atlas Map, I still wanted to be able to offer Indigenous-themed lessons if that was what teachers wanted. This was the case with the only tenth-grade teacher in the district to book a map session -she wanted a lesson related to residential schools. To prepare for this session, the teacher, Mrs. Hazell, had her students research every residential school that existed in Canada and make an info card for it. The residential schools from each province were on separate colours of paper. The info cards seemed a bit large when it came time to place them on the map, so we folded them into quarters – this actually had a great effect as it gave the information a 3-D look which was more impactful.

Even though Mrs. Hazell and I have been teaching students about residential schools for a decade and a half, the impact of this activity was still intense. The visual locations of the schools led to great discussions about history and geography and settlement patterns. We needed more time for this one!

Needs Just a Bit of Tweaking

The last class of the day was a request for a Junior High MATH lesson. For this lesson, I used a lesson activity from the Natural Resouces Map. This was a very active lesson where we got out tape measures and crawled around on the map measuring the “highway” distance between two locations. Mrs. Cooper then gave a review lesson on proportion: the scale of this map is 1:6 000 000.

Biggest Improvement

The biggest improvement for today was that I discovered the plastic “chains” and pylons that come with the map. The chains helped to highlight parts of the map for the little kids. We “chained” borders around Alberta and Nunavut several times today.

This chained border around Nunavut was particularly impactful with students in grade 5 and above as we talked about how the purpose of the map “insets” or “pop-outs” was to better show the number of Members of Parliament in a region. Although I talked a fair bit with the grade 5 and 6s about MPs, we didn’t do the actual representation by population activity as they have not yet covered that part of the grade 6 curriculum. At any rate, Nunavut is huge, and it only has a single MP. (Calgary has 10, Toronto has 25.)

Biggest Flop

The biggest flop of the day was with this same grade 5 and 6 class. We attempted to play an Amazing Race type Canada-quiz game. I followed the suggestions in a lesson from the Natural Resouces Map, (modified for the locations visible on this map.) This was not a huge success. 4 groups of students are supposed to listen to a clue and then try and figure out the answer (using legend, scale, knowledge of provinces, etc) and be the first to place their pylon on the correct response. A few issues that I need to resolve:

  1. Students are weak listeners and are used to “seeing” instructions; the verbal clues (as suggested in the lessons plan) were very difficult for them to follow. I realized this after the first clue and gave each group whiteboards and markers, but discerning what keywords to write down was also difficult.
  2. Being the “first” to place their pylon also had issues. What if they were incorrect? I thought that I would wait for each clue until all groups had placed a pylon, but that took too long. Many of the clues were location A or B… this resulted in big clusters of kids around the locations — trouble!

Solution?: Maybe give each group a list with all of the clues? Then they write their answers on the papers and the group that gets the most correct answers after X minutes is the victor? This would solve the “listening” issue! They could do clues in any order which would help with the congestion; or maybe we indicate a “shotgun” start like in golf?? This might be a good strategy for Monday at Margaret Wooding School, when there will be multiple grades of classes to visit the map. 3 classes of 12 groups each… Hmmmm, that’s a contest!

Day 1: Giant Floor Map of Canda

It has finally arrived! After an unexpected and disappointing delay of several days, the giant floor map of Canada arrived at approximately noon. I was relieved because that gave me just enough time to get to this afternoon’s originally scheduled Giant Floor Map experience at Prairie Mennonite Alternative School, just a few minutes drive from my house.

Hypothetically, the map was supposed to be delivered to our district office, but when the shipping/tracking updates unexpectedly came through with my home address, I knew I had to stick close to await the arrival. Fortunately, delivery was smooth.

In a very appropriately Canadian way, the map travels in its own hockey bag! As you might tell from the size of the map in the images below, the bag is pretty heavy. Fortunately, it is a “wheeled” hockey bag, and I am just able to heave that thing into the trunk of my car.

Packing and unpacking is definitely a two-person job. Thanks, Mrs. H. for help with the first unveiling! And 3rd-grade student Trudy was a splendid pack-up helper.

This map is magical. Adults are certainly drawn to it. They reverently take off their shoes and immediately go searching for the locations that are important to them. And then the stories start….

Today’s grade 2/3 group was a good one to start with. I have many, many activities planned for all ages and subjects, but my most anticipated ones are for grade 2 students. Grade two Social Studies does a comparative study of 3 Canadian communities – one on the plains of Saskatchewan, one in Nunavut, and one in New Brunswick. I created a sorting activity with beautiful pictures of wildlife from each different region. The rollout of this part of the lesson was not stellar. I will have to get better at managing where students sit or stand – close enough to be able to see necessary detail but spread out enough to see the whole map.

Fortunately, I get to try again first thing tomorrow morning with the grade two students at Foremost School. By the end of the day, I will have worked with 6 classes and tried out almost all of my lesson options! Until then…

Investigating similarities of wildlife that lives in the Arctic.

Active Learning: Giant Floor Map of Canada

It’s the 3-day countdown until the giant Floor Map of Canada arrives from Canadian Geographic. How big you ask? 10.7 m x 7.9 m (or approximately 35′ x 26′). Check out the Canadian Geographic overview here.

For two weeks I will be the keeper and driver and deliver of the map. My friends who have had a giant map experience before say that it is HEAVY, and appropriately for a map of Canada, comes in a wheeled hockey bag.

For the past few weeks, I have been working on choosing and creating content to match with different grades and different curricula. I’m hoping that this won’t just be a Social Studies experience, (because it IS a map), but that teachers will take up my offer to connect the map to other subjects like math (scale, angles, directions, etc.), Language Arts (prepositions, adverbs, etc; storytelling….)

As this is another one of those “Trying Something New” experiences, I will likely feel compelled to blog about it. So, in the next few weeks, look forward to some pictures and updates in this space.

At this point, it feels like there might be lots of iterations in my lesson plans! I’ve ordered a “political” map that shows all 338 federal electoral districts, partly because it also had good geographical features and political boundaries. And just to mix things up and try to offer diverse experiences, I am pulling and modifying lesson ideas from three other entirely different maps. And creating some ideas from scratch!

Never a dull moment. But, it has been a while since I have stretched the Social Studies region of my brain!