
Here is a summary of the Giant Map around Prairie Rose School District in March 2022:
Number of sites visited: 17 (= 17 times packing and unpacking!)
Kilometres travelled: 2552 km
Classes visited: 62 different groups


Click the buttons above to read about all of the activities that I tried out with the giant Canadian Political Floor Map of Canada. There are lots of stories of fun things that we did as well as changes to activities that I made along the way to improve the flow of map experiences.
The map we had was a “political map” which featured the 338 political ridings in Canada, but I chose it as it also showed provincial borders, as well as topography and vegetation cover, making it versatile for a variety of acitivities and curriculum connections. Keep reading for some of the activitiy highlights.
Residential School Sites
The first time we did this activity at Foremost School, Mrs. Hazell’s grade 10 students had written residential school names, dates and approximate # of students on different coloured papers for each province. This was the first of many times that I was impacted by this activity, even though I know lots about the history of residential schools. The coloured paper for each province was a brilliant idea and thanks to Mrs. Hazell, I gathered my own coloured paper for when I would repeat this activity with Junior High students at two other schools. In the foreground of the image below, there is a lone light pink coloured paper on New Brunswick – the distinct coloured paper per province led to many thought provoking questions about the location and distribution of these schools across Canada.


Nunavut is big: provinces and sizes of federal electoral ridings

With almost 2/3 of the lessons with the giant map, we use the plastic chain markers (that come with the map) to trace the outline of Nunavut. Nunavut is BIG.
For younger students, this is just a fun part of reviewing the provinces/territories of Canada. For older students, I use this same activity in our discussions about representation by population. On average, each of Canada’s electoral districts represents approximately 100 000 Canadians. Before outlining Nunavut, we look at the Greater Toronto Area with its 6.7 million population and approximately 60 electoral districts, including Canada’s geographically smallest riding of Toronto Center. At just 5 square kilometers it has 120 000 people and is about the same geographical size as the small towns that our schools are located in. After this, we work together to outline Nunavut, and a student usually makes the observation that this whole area is only one electoral district. But wait… there’s more. The entire population of that huge Nunavut is around 40 000. This leads to some great discussions about Canada.
Grade 2 Social Studies Communities (and animals)
In Alberta, grade 2 Social Studies students currently study three Canadian communities: one from the prairies (often Saskatoon), one from the Maritimes (often Meteghan, New Bruswick), and the northern community of Iqaluit, Nunavut. For grade 2 students, it is quite exciting to actually plot these communities that they have been studying on the giant map. 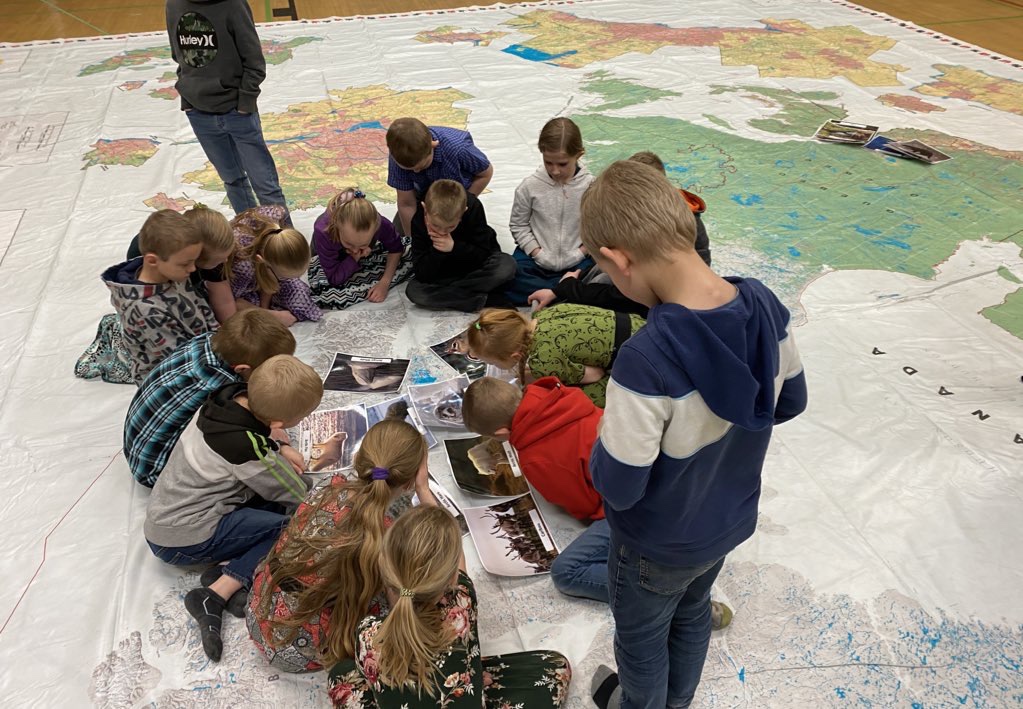 Then we use the legend on the map to identify the different vegetation cover at each location, and finally we gather around and do an animal sort of about 20 different animals that would be native to one of the 3 communities. This often leads into a student obervation about the colours of animals from the regions (eg. Nunavut=white; Prairie = brown/yellow) and a great science conversation about adaptation.
Math: Calculating distances with scale
The original lesson plan idea here came from the lessons of the Natural Resources giant map. I have the grade 6 or 7 or 8 teacher review ratio and scale with students so that . Each student then has a white board and marker as I model how to measure the distance in cenimeters between 2 locations on the map via transportation routes. 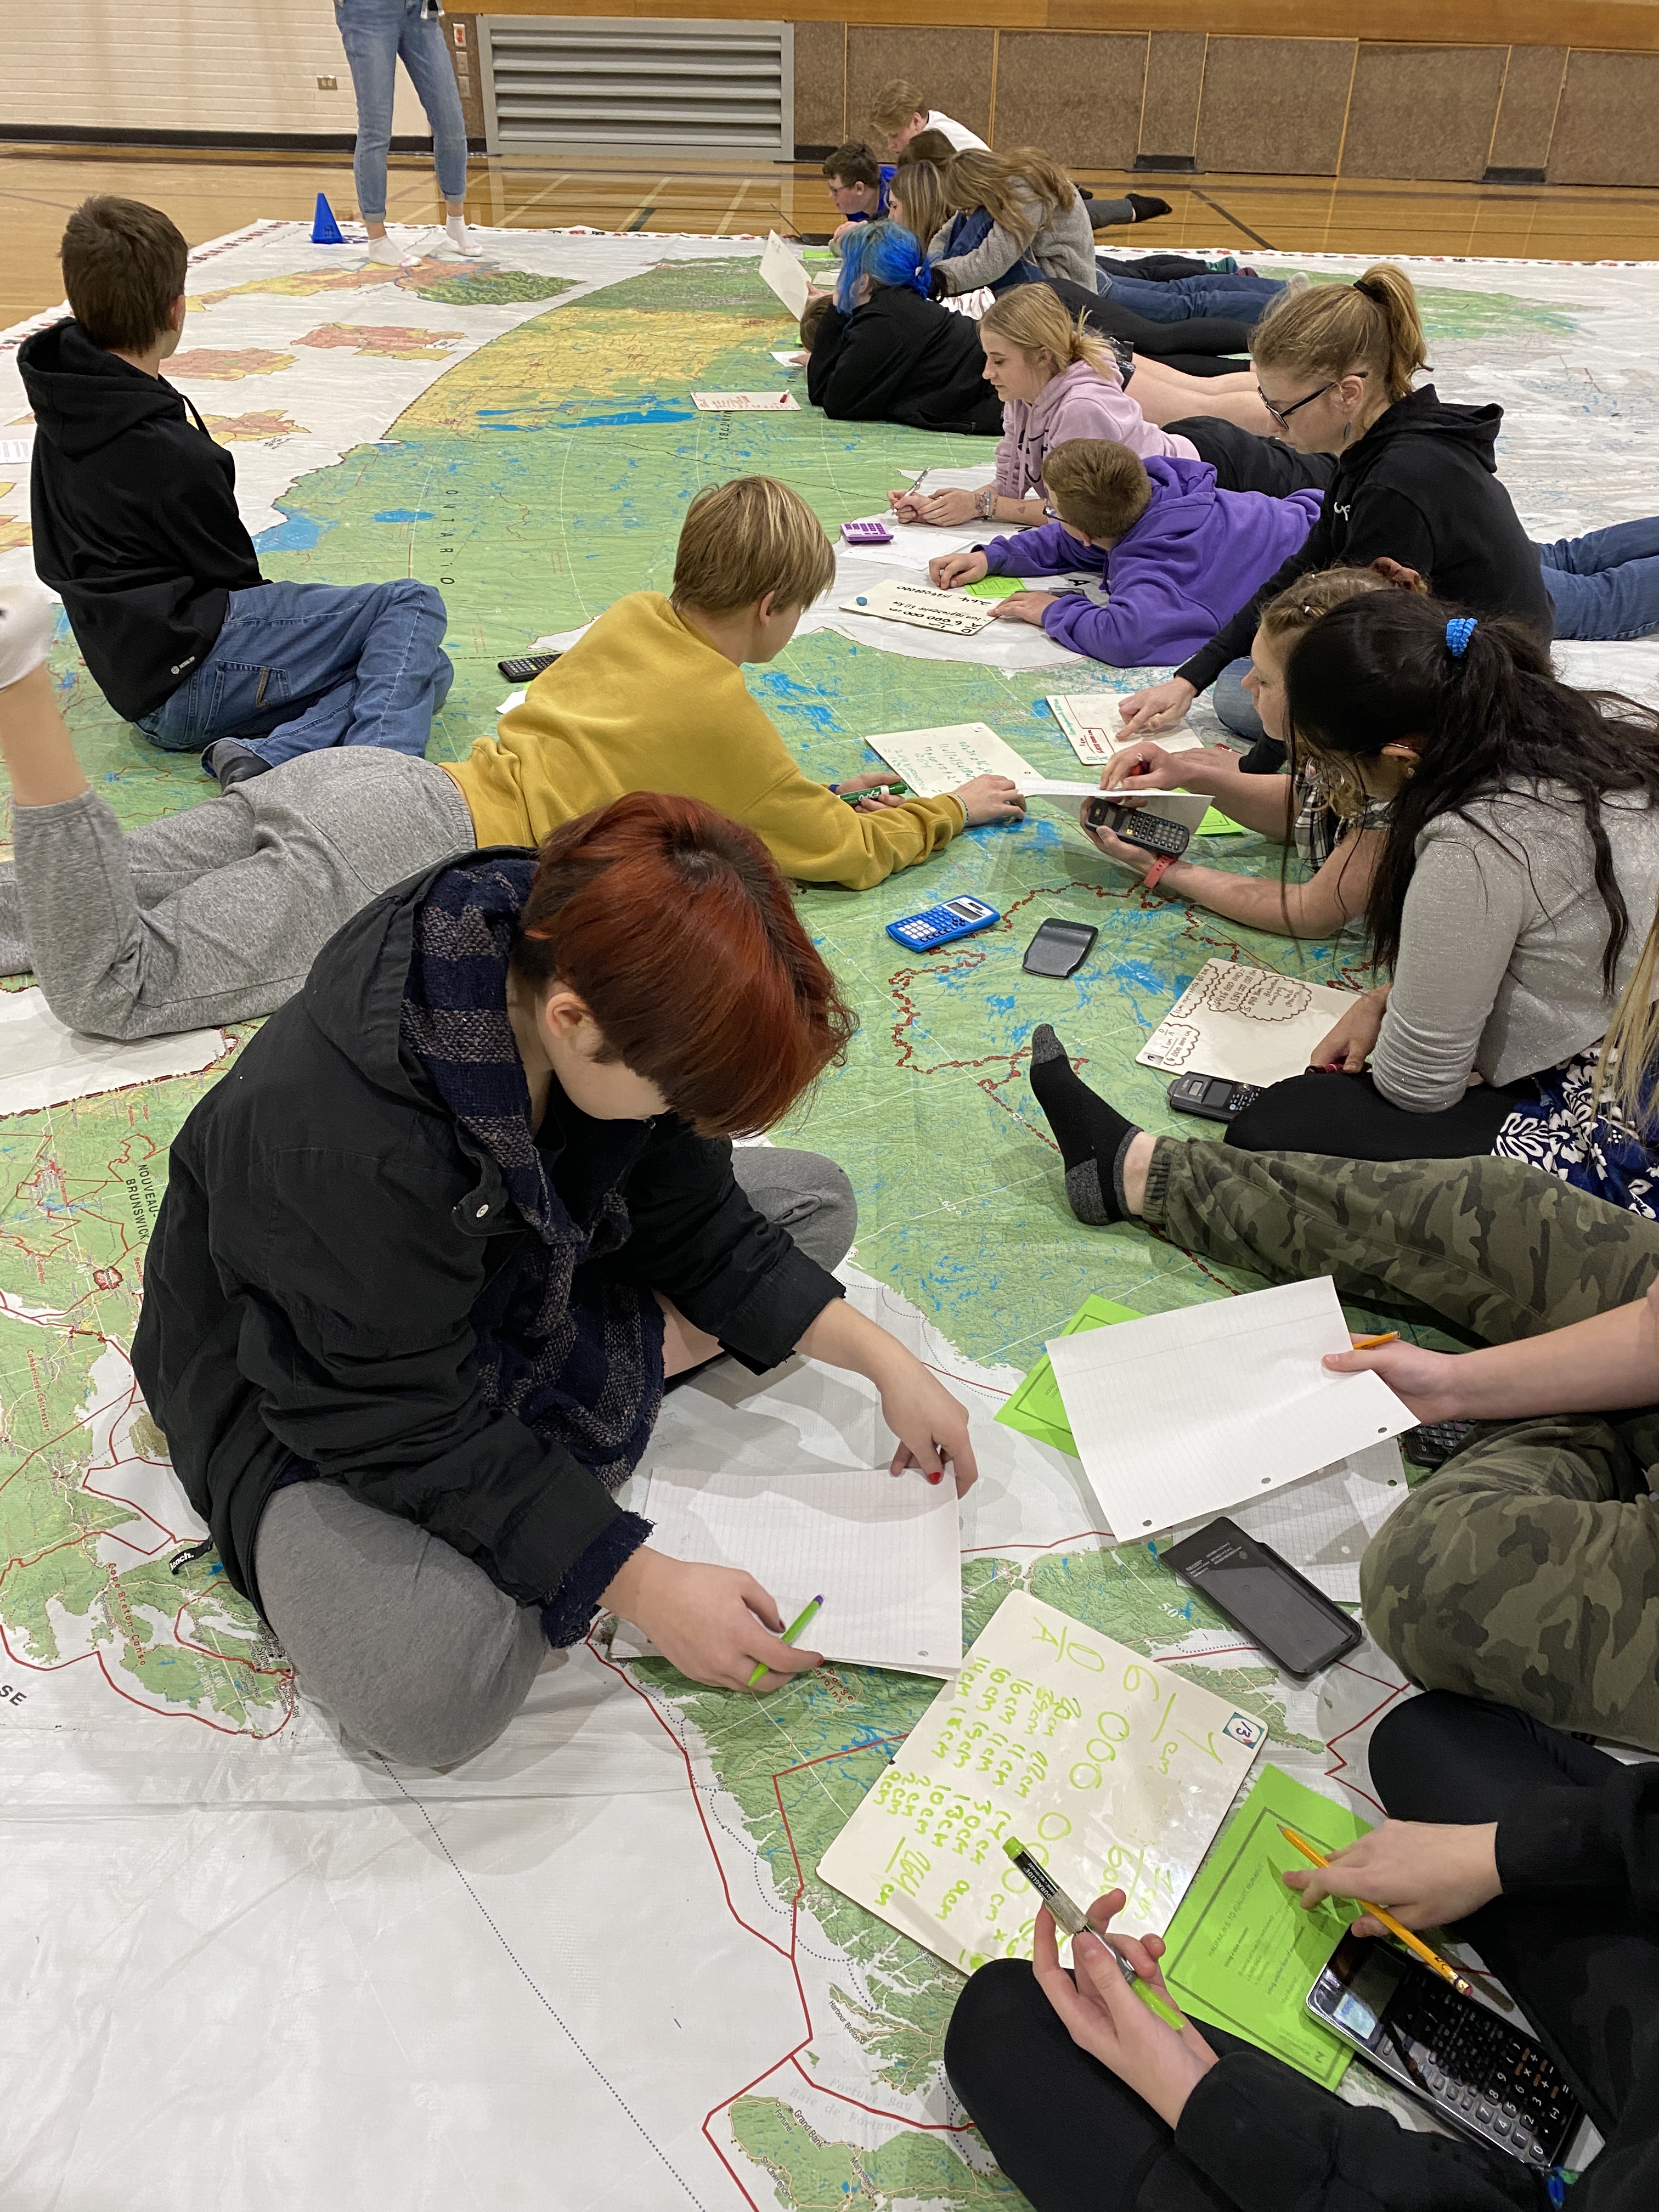 They add up the numbers as I fire them off and once we have a total we use the scale to calculate distance and eventually get to kilometers. Student pairs then get assigned two locations and they have to measure and then calculate the distance between the two using transportation routes.
Latitude and Longitude + Energy Sources
Another lesson plan from the Natural Resources giant map has about 80 images of power generation sites across Canada with corresponding latitude and longitude. When I’ve had a longer session with students in grade 4 and above this makes for a good add-on to one of the activities above. It always has to start with a mini-lesson on latitude and longitude as students typically do not know these terms or have only been introduced to them briefly. After modelling how to place a few of the location cards, each student pair gets 3 cards to place using lattitude and longitude. At this point, the teacher usually thinks that will be too many, too difficult, but within a few minutes, students are coming to ask for more cards to plot, and it doesn’t take long until we have the map covered. In a perfect world, we have time to make observations about locations of energy production in Canada, but often this activity ends while we are finding the locations and the students leave with a very hands-on experience with latitude and longitude. Yay geography!!

Pingback: #Giant Map of Canada…back in PRPS | What I learned today...
Pingback: Giant Map of Canada in PRPS 2023 | What I learned today...